Wind Power Trading in Complex Terrrain:
The value of probabilistic forecasts for decision making?
Publication analyses for workshop data
2024-02-28 09:01:01
Ranking
Final payoffs
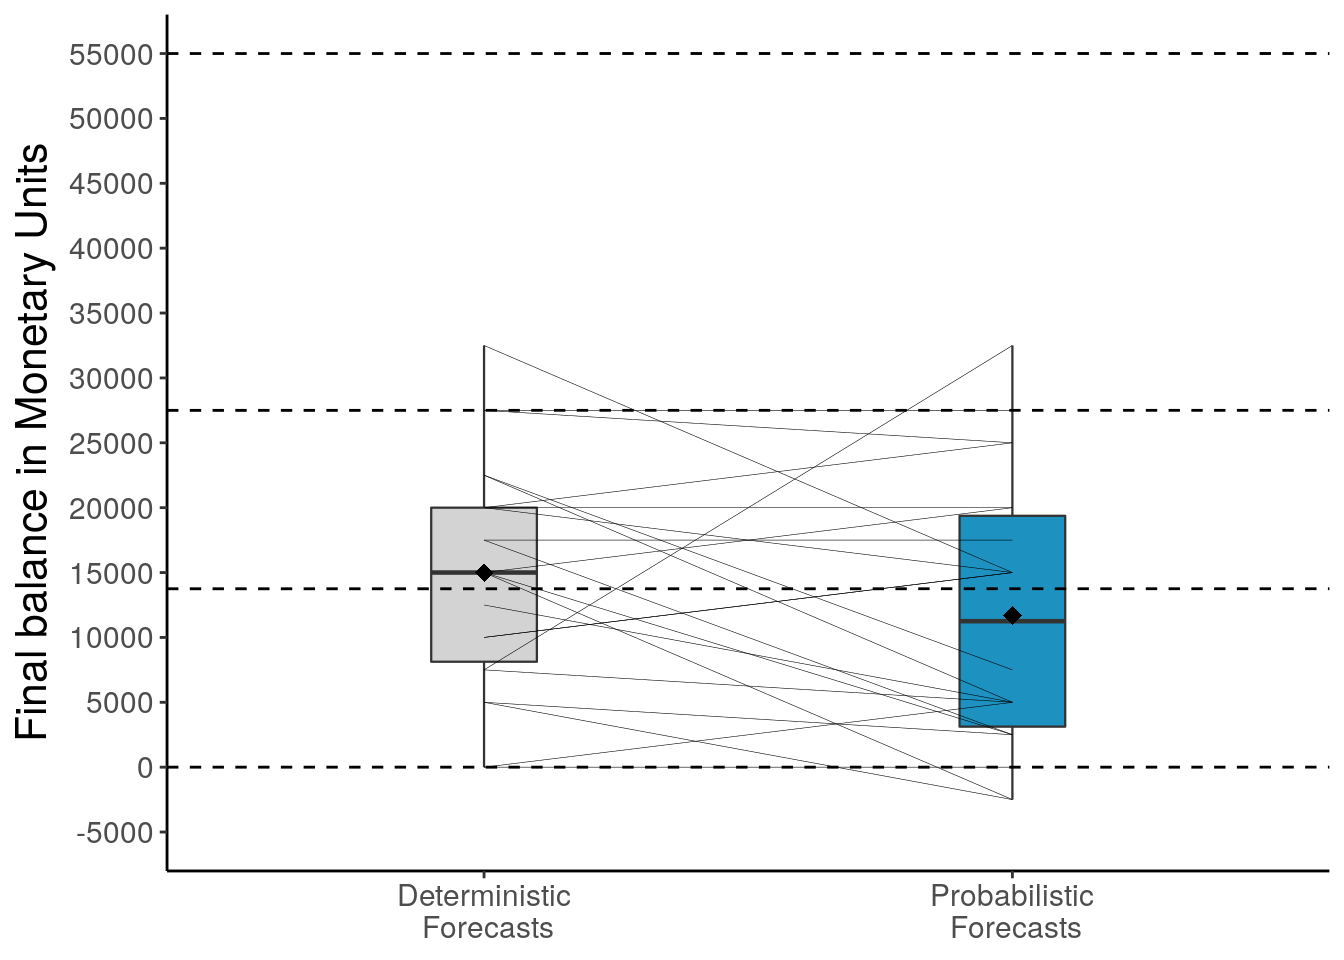
Distribution of participants’ final payoffs for deterministic and probabilistic forecasts
# A tibble: 4 x 2
  strategy    finalBalance
  <chr>              <dbl>
1 allRisky               0
2 allSafe            27500
3 godseye            55000
4 chanceLevel        13750
# A tibble: 2 x 4
forecast mean median sd
<chr> <dbl> <dbl> <dbl>
1 deterministic 15000 15000 8830.
2 probabilistic 11705. 11250 10333.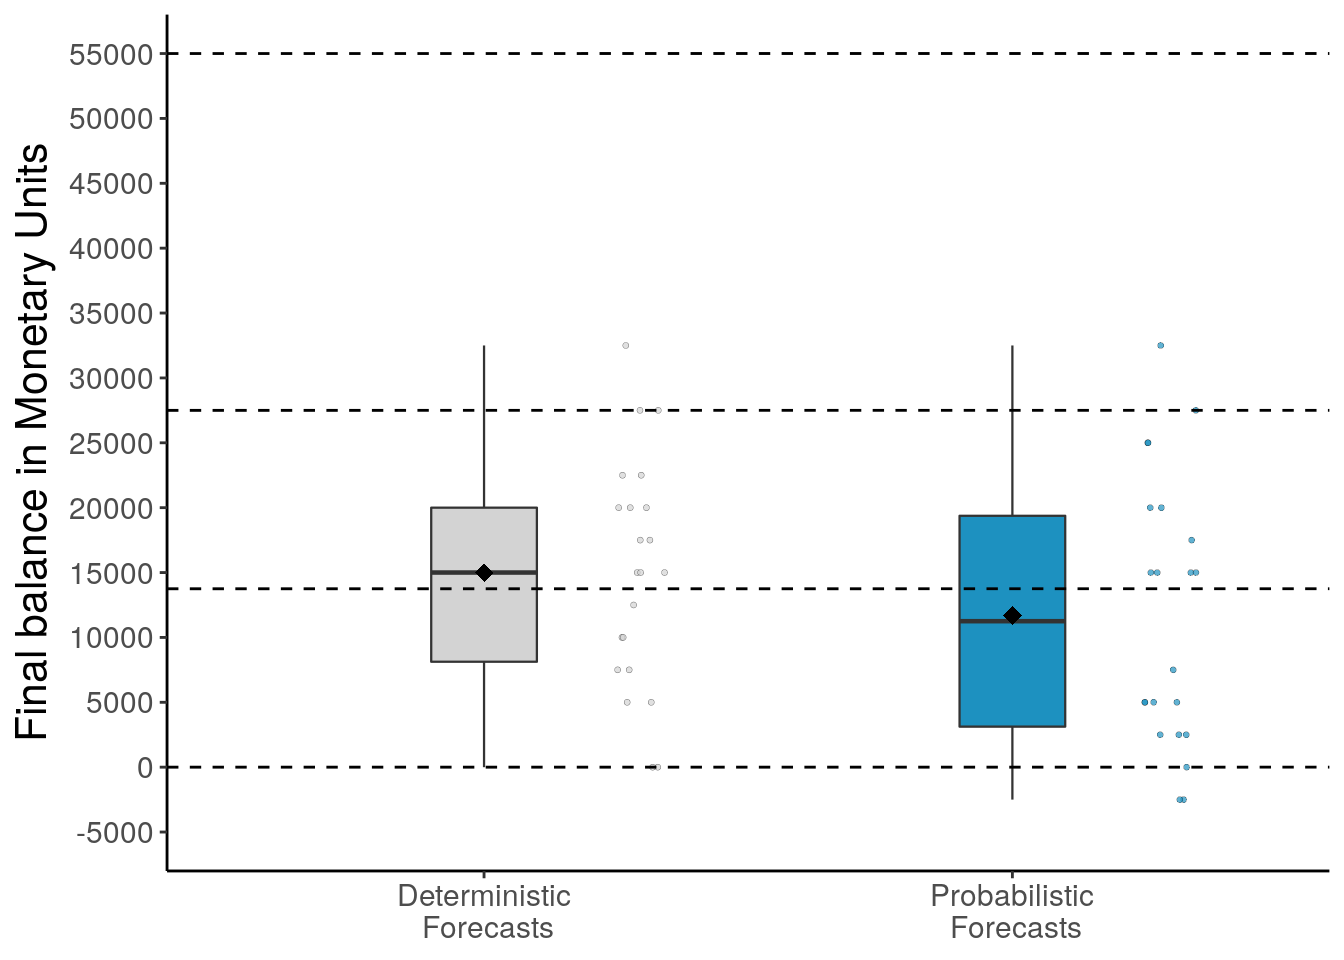
# A tibble: 4 x 5
# Groups:   forecast [2]
  forecast      orderBlocks   mean median     sd
  <chr>         <chr>        <dbl>  <dbl>  <dbl>
1 deterministic detProb     17188.  18750  8066.
2 deterministic probDet     13750   11250  9290.
3 probabilistic detProb     14375   18750 10415.
4 probabilistic probDet     10179.   6250 10353.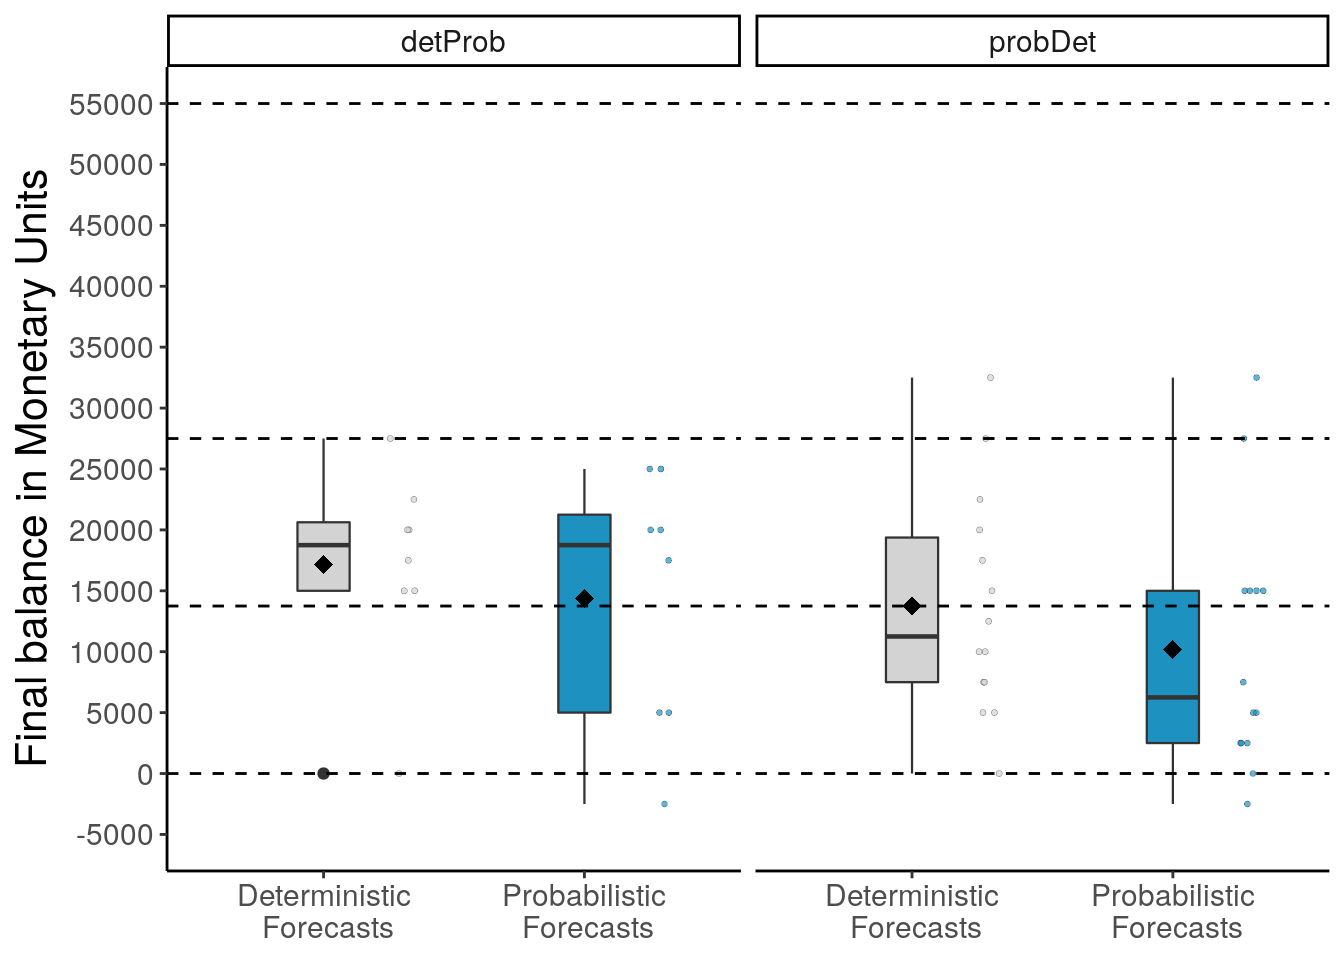
Benefit of probabilistic forecasts
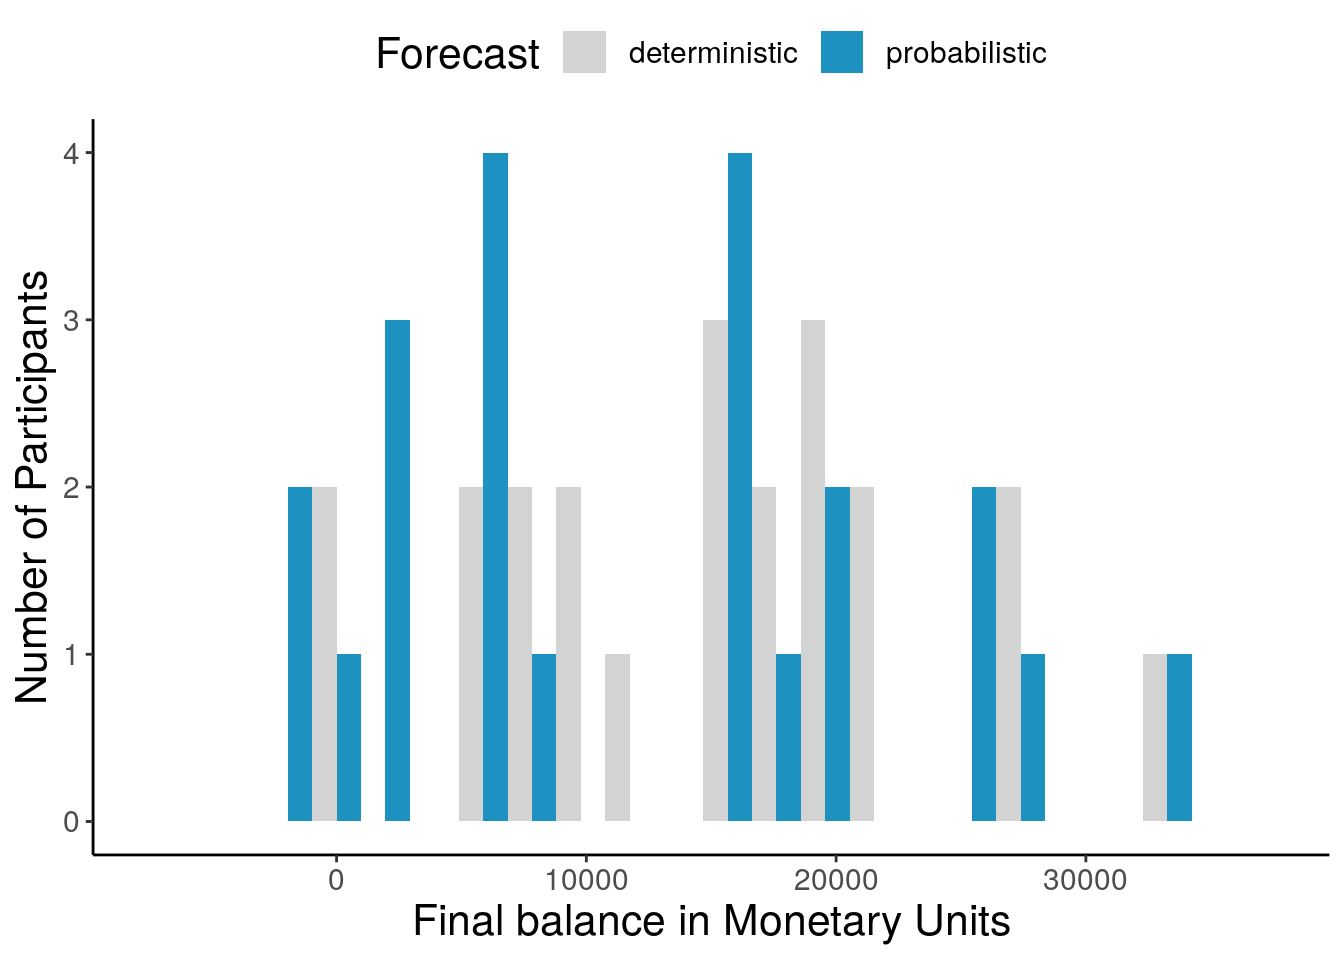
Histogram based on the difference between each participants final payoffs based on probabilistic minus deterministic forecasts.
Positive values mean higher final payoffs with probabilistic forecasts, negative values mean higher payoffs with deterministic forecasts.
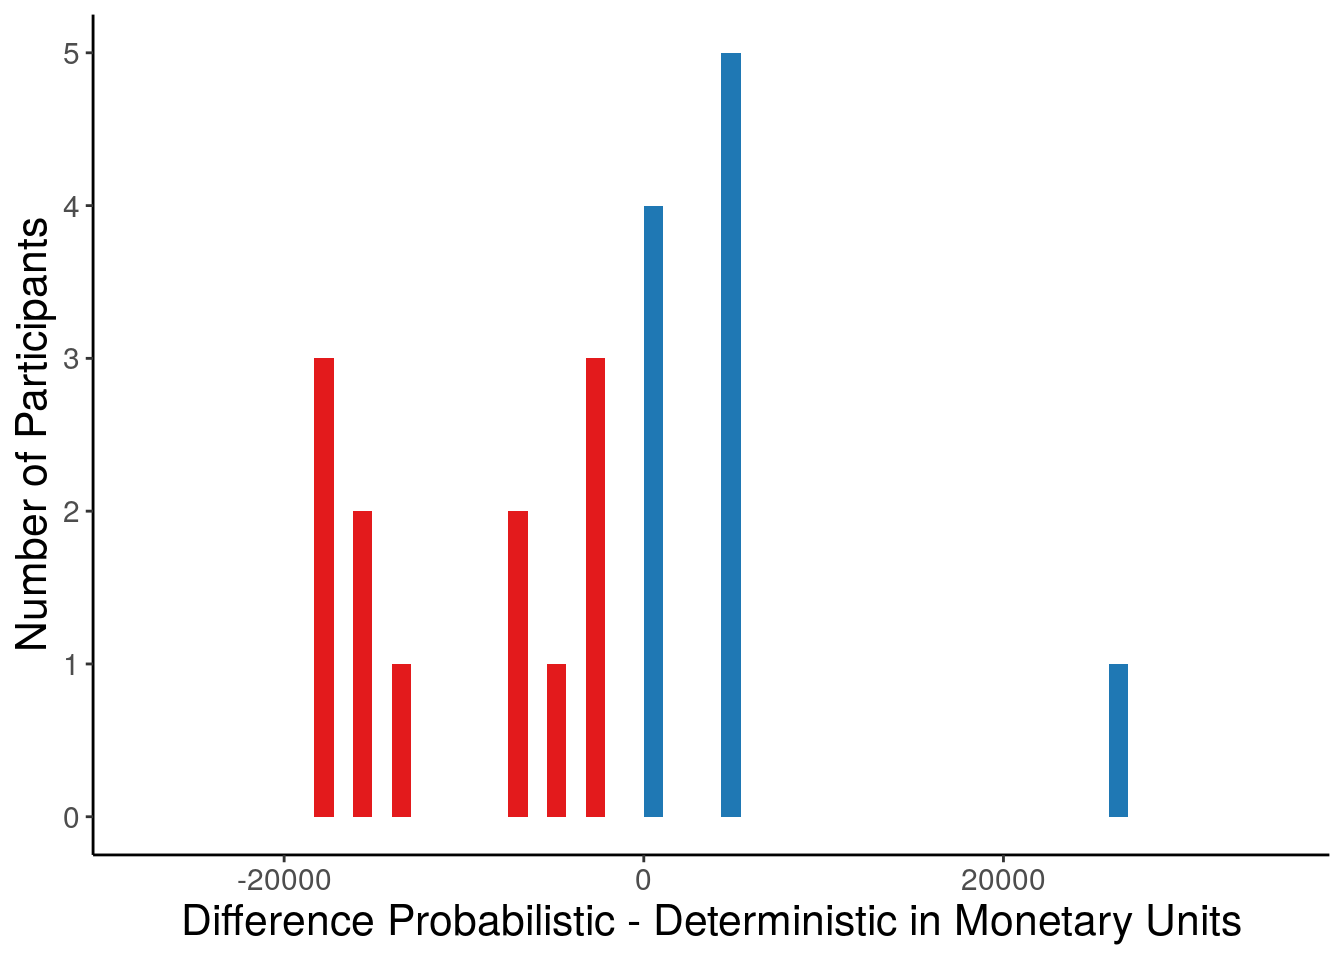
   Min. 1st Qu.  Median    Mean 3rd Qu.    Max.
  -2500    3125   11250   11705   19375   32500
Min. 1st Qu. Median Mean 3rd Qu. Max.
0 8125 15000 15000 20000 32500 Proportion different decisions
Proportion different decisions with deterministic vs. probabilistic forecasts
# A tibble: 2 x 3
  changed      n proportion
  <chr>    <int>      <dbl>
1 change     174      0.360
2 noChange   310      0.640
NULL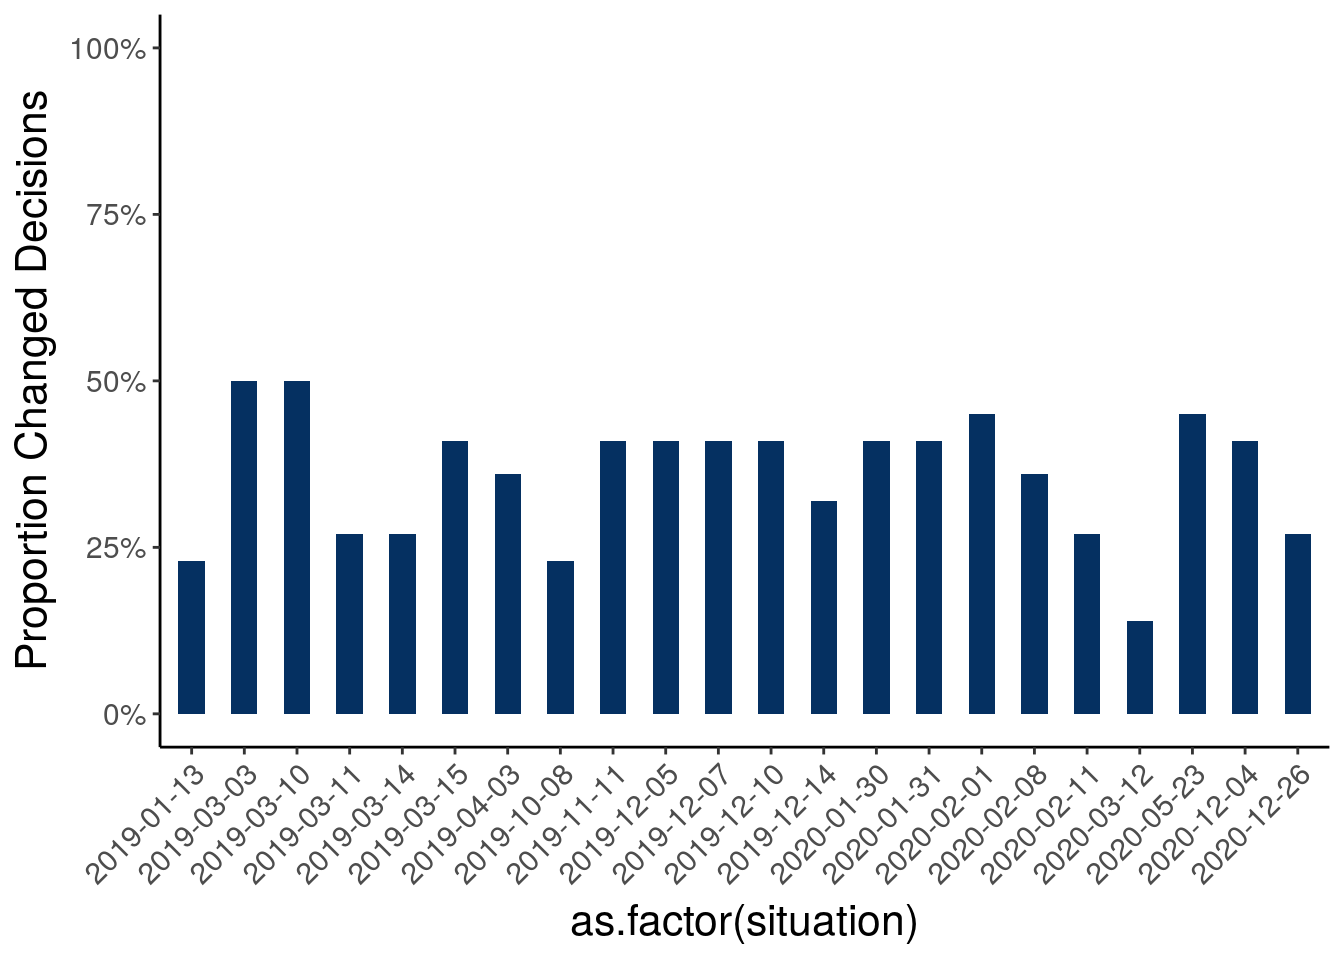
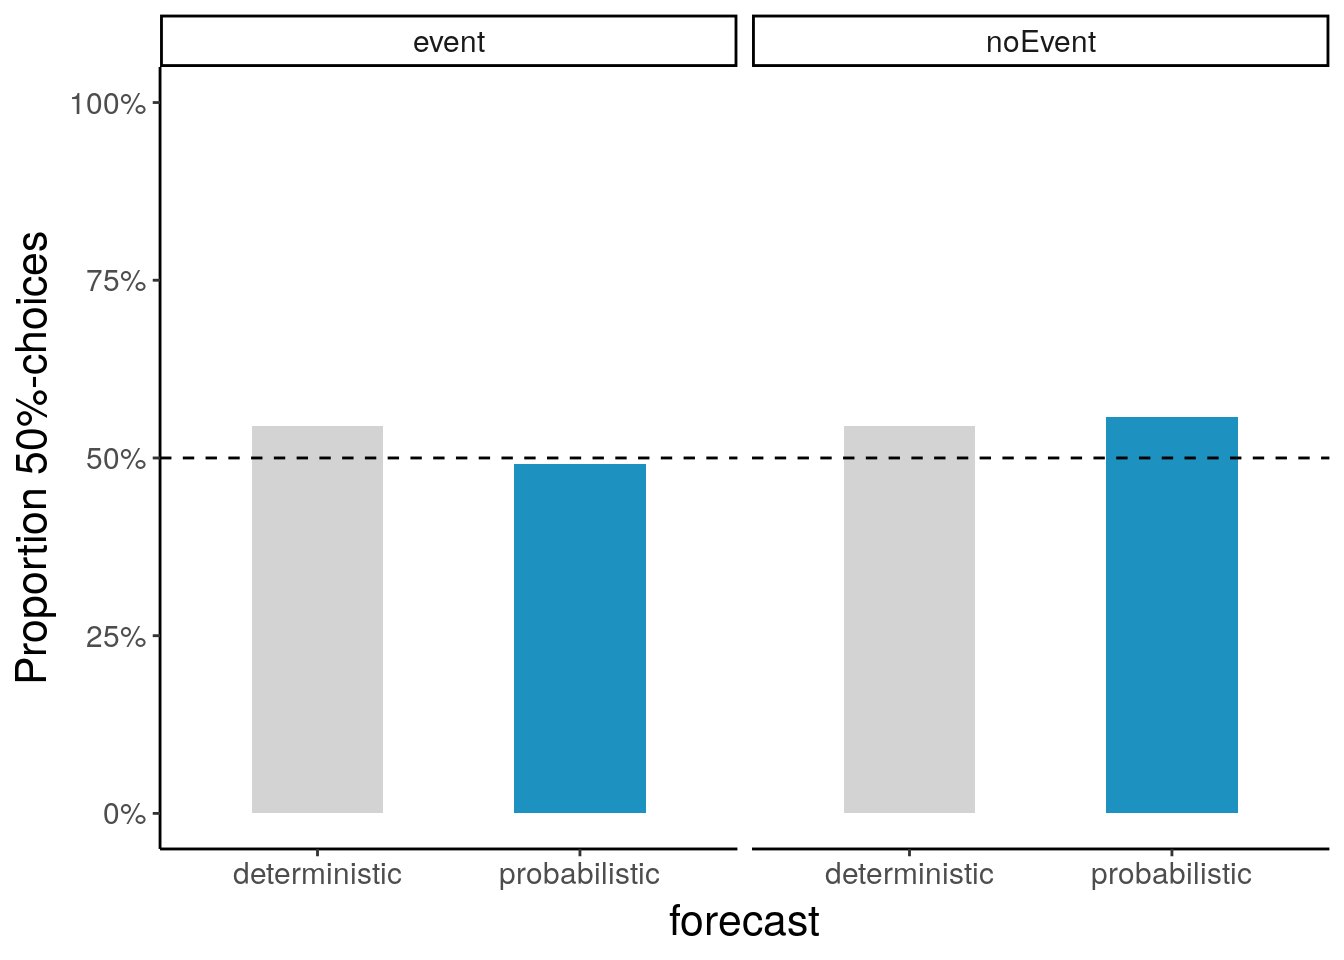
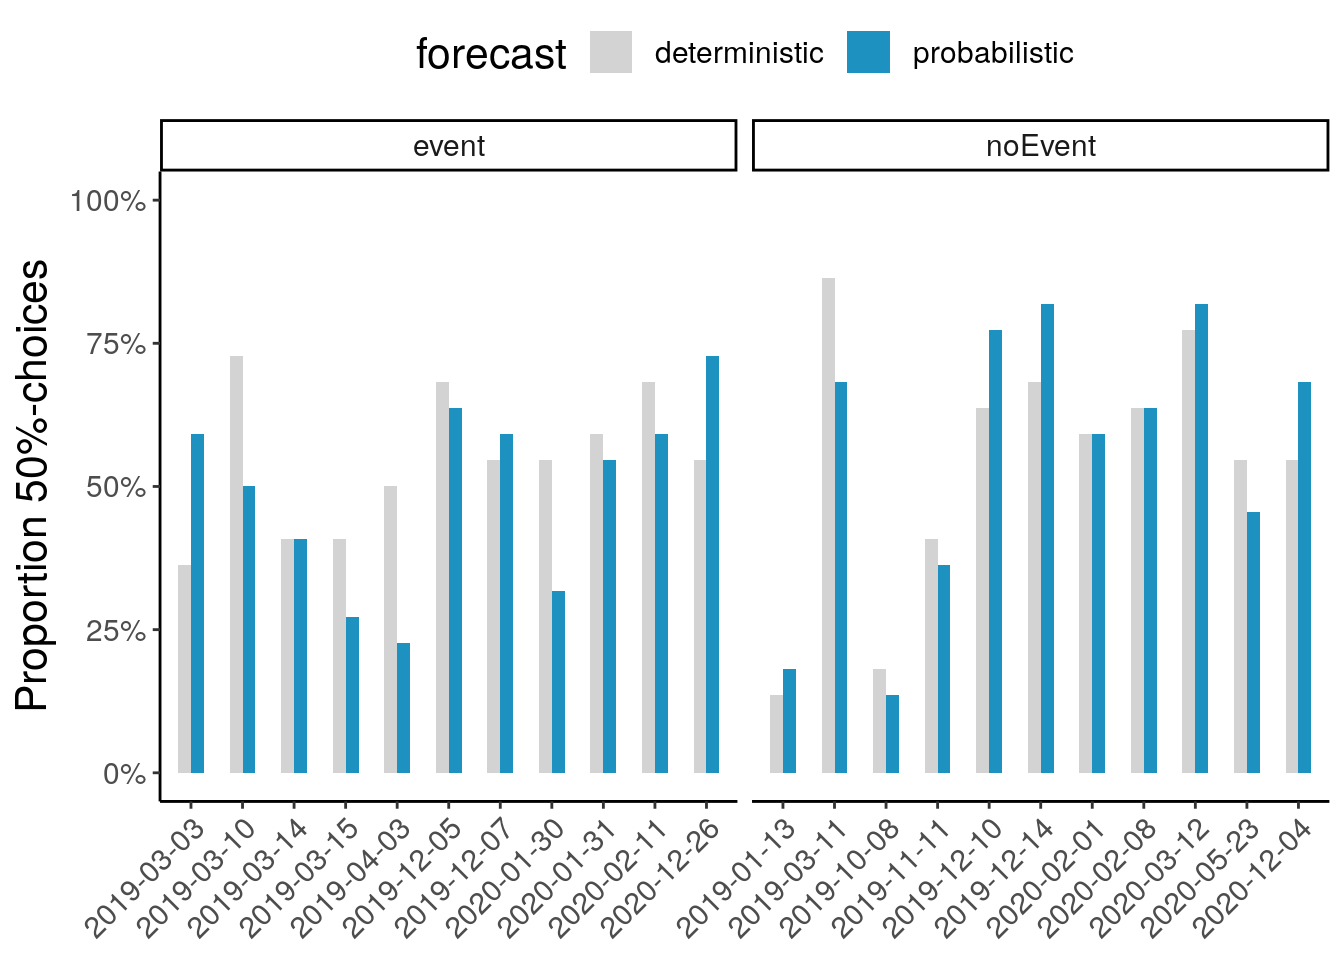
Proportion safe decisions
Proportion of safe decisions ("trading 50%) with deterministic vs. probabilistic forecasts
# A tibble: 2 x 3
  forecast      median  mean
  <chr>          <dbl> <dbl>
1 deterministic  0.591 0.571
2 probabilistic  0.545 0.550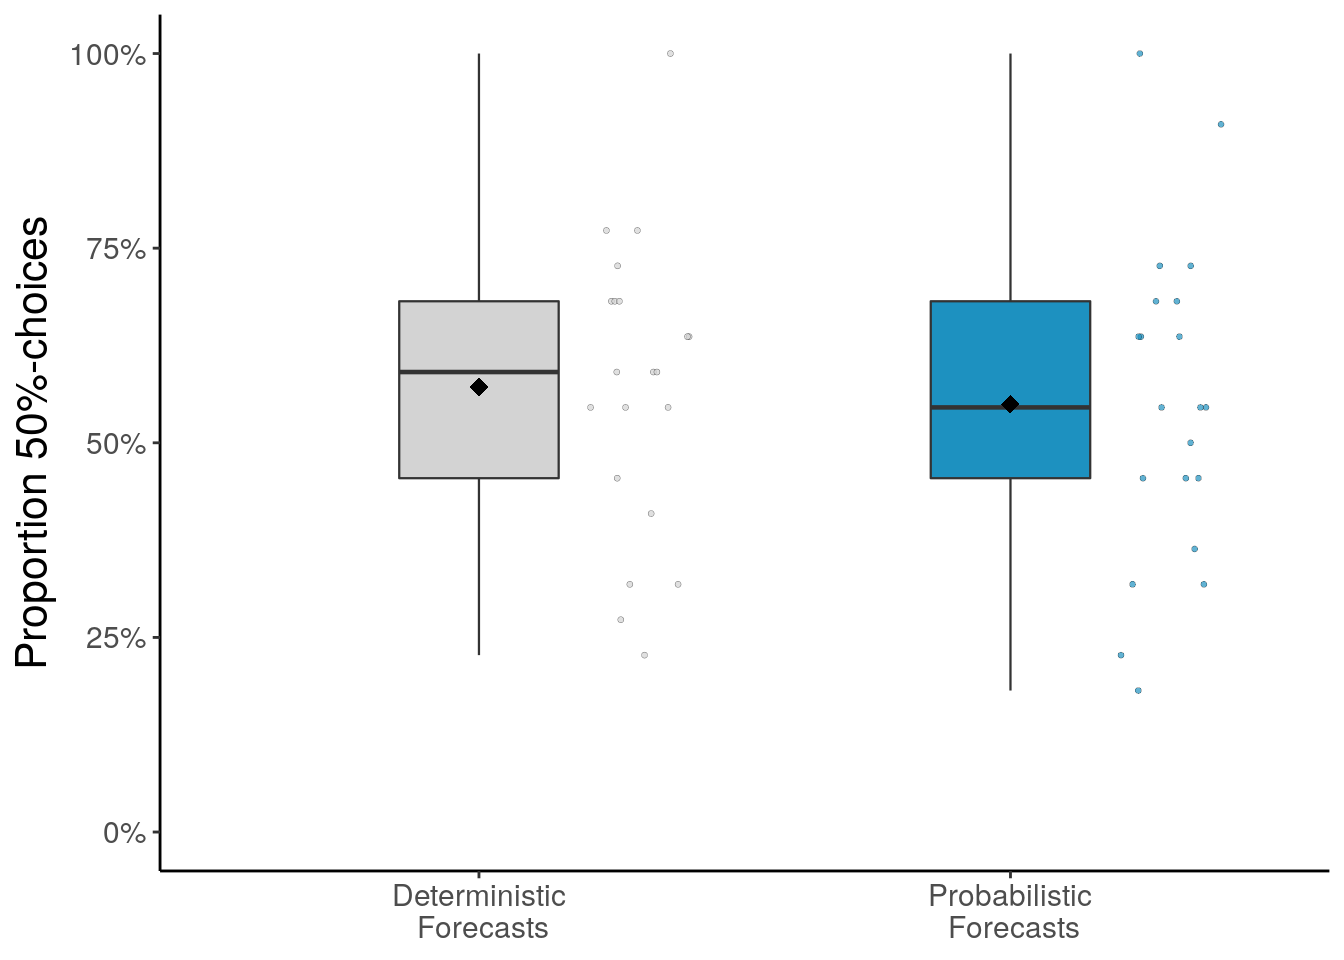
# A tibble: 84 x 6
# Groups:   subID, forecast, event [88]
   subID forecast      event   riskyDecision     n proportion
   <int> <chr>         <chr>   <chr>         <int>      <dbl>
 1  4048 deterministic event   no               11      1
 2  4048 deterministic noEvent no               11      1
 3  4048 probabilistic event   no               11      1
 4  4048 probabilistic noEvent no               11      1
 5  4049 deterministic event   no                5      0.455
 6  4049 deterministic noEvent no                4      0.364
 7  4049 probabilistic event   no                3      0.273
 8  4049 probabilistic noEvent no                7      0.636
 9  4050 deterministic event   no                6      0.545
10  4050 deterministic noEvent no                6      0.545
# … with 74 more rows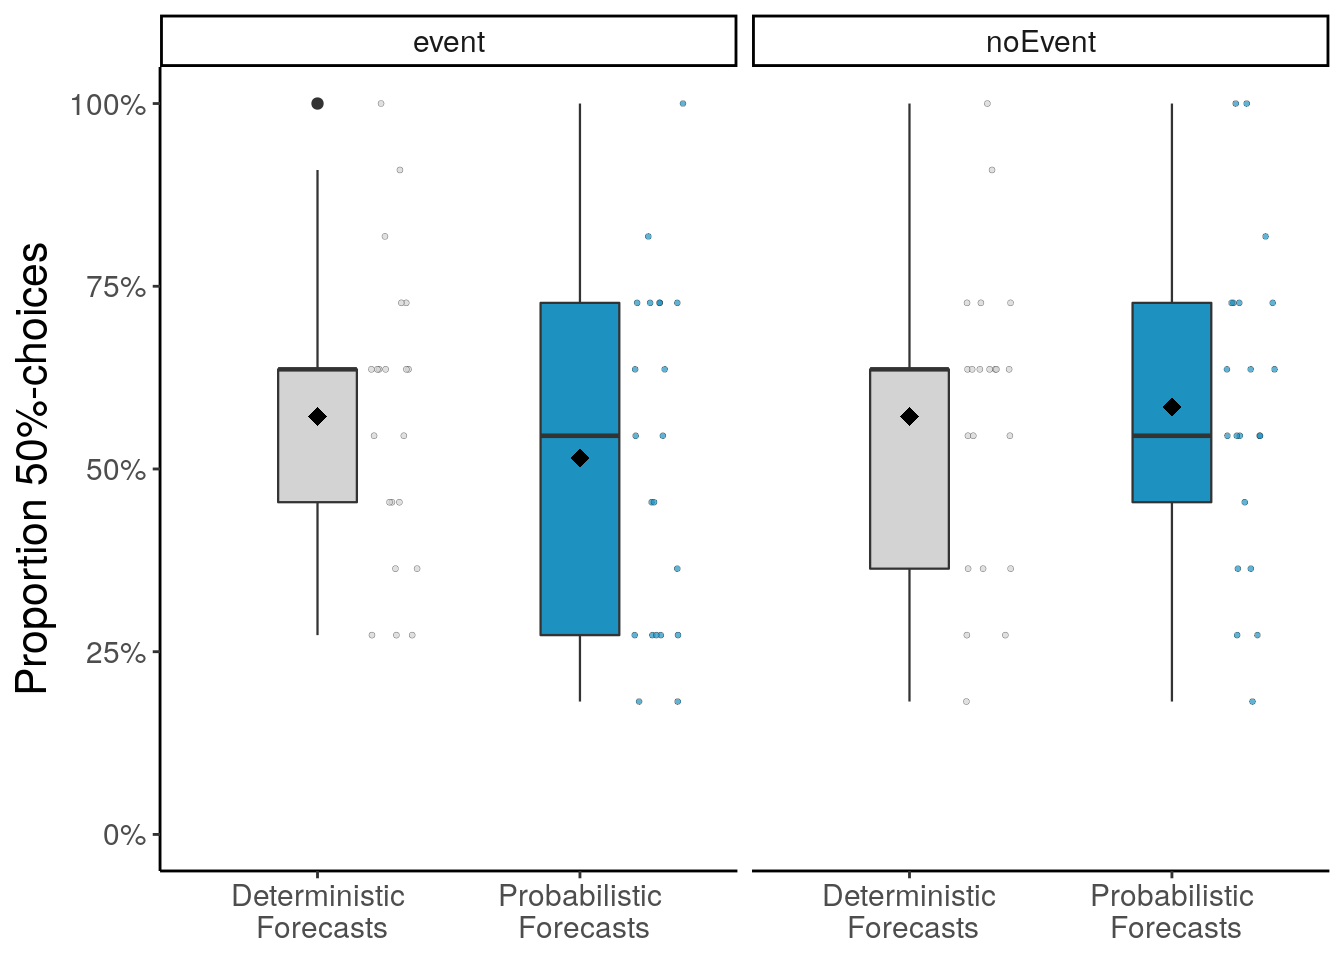
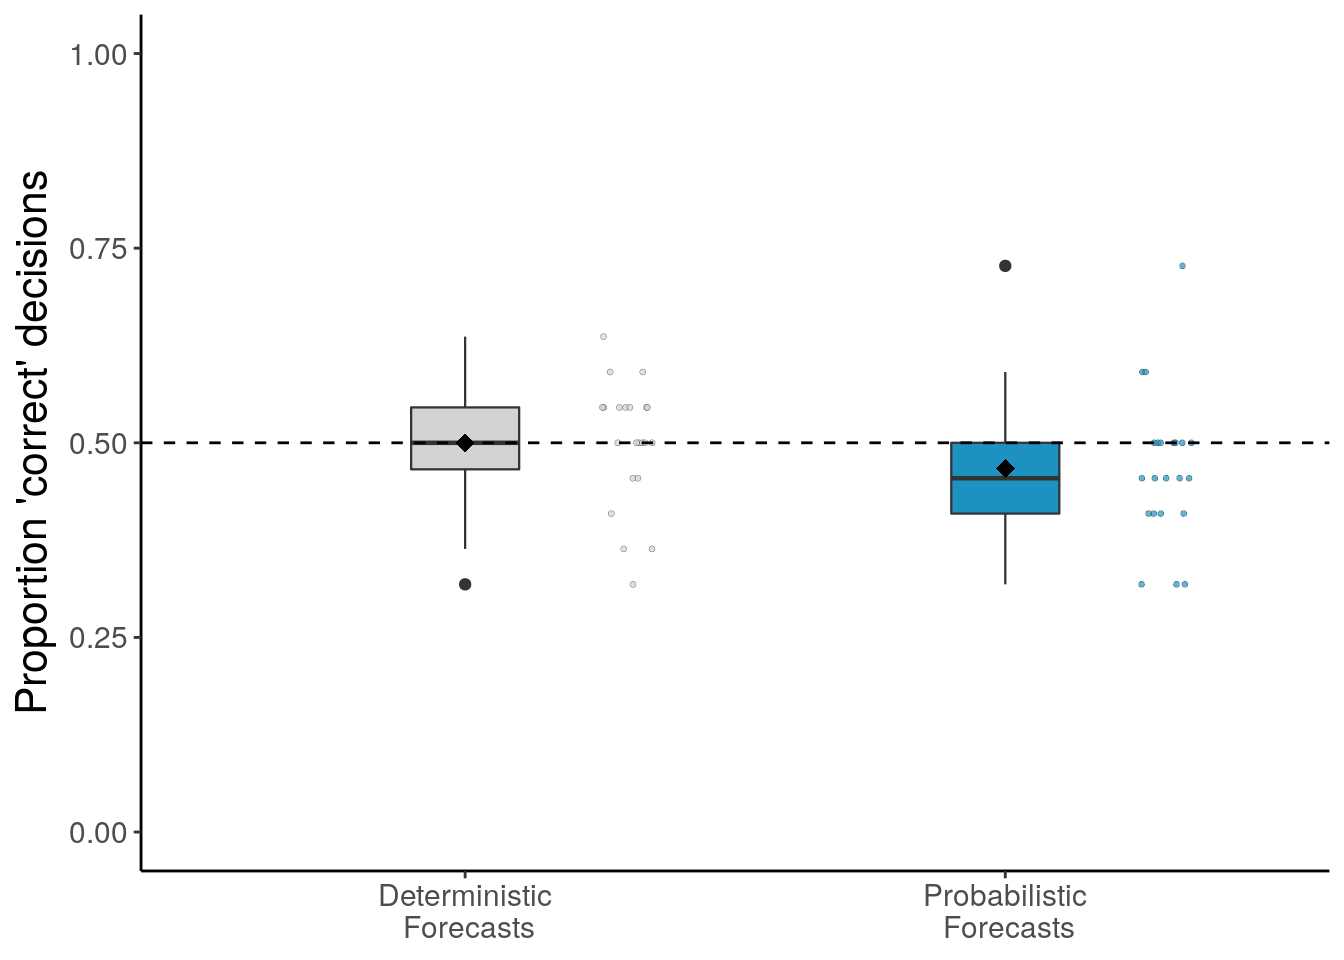
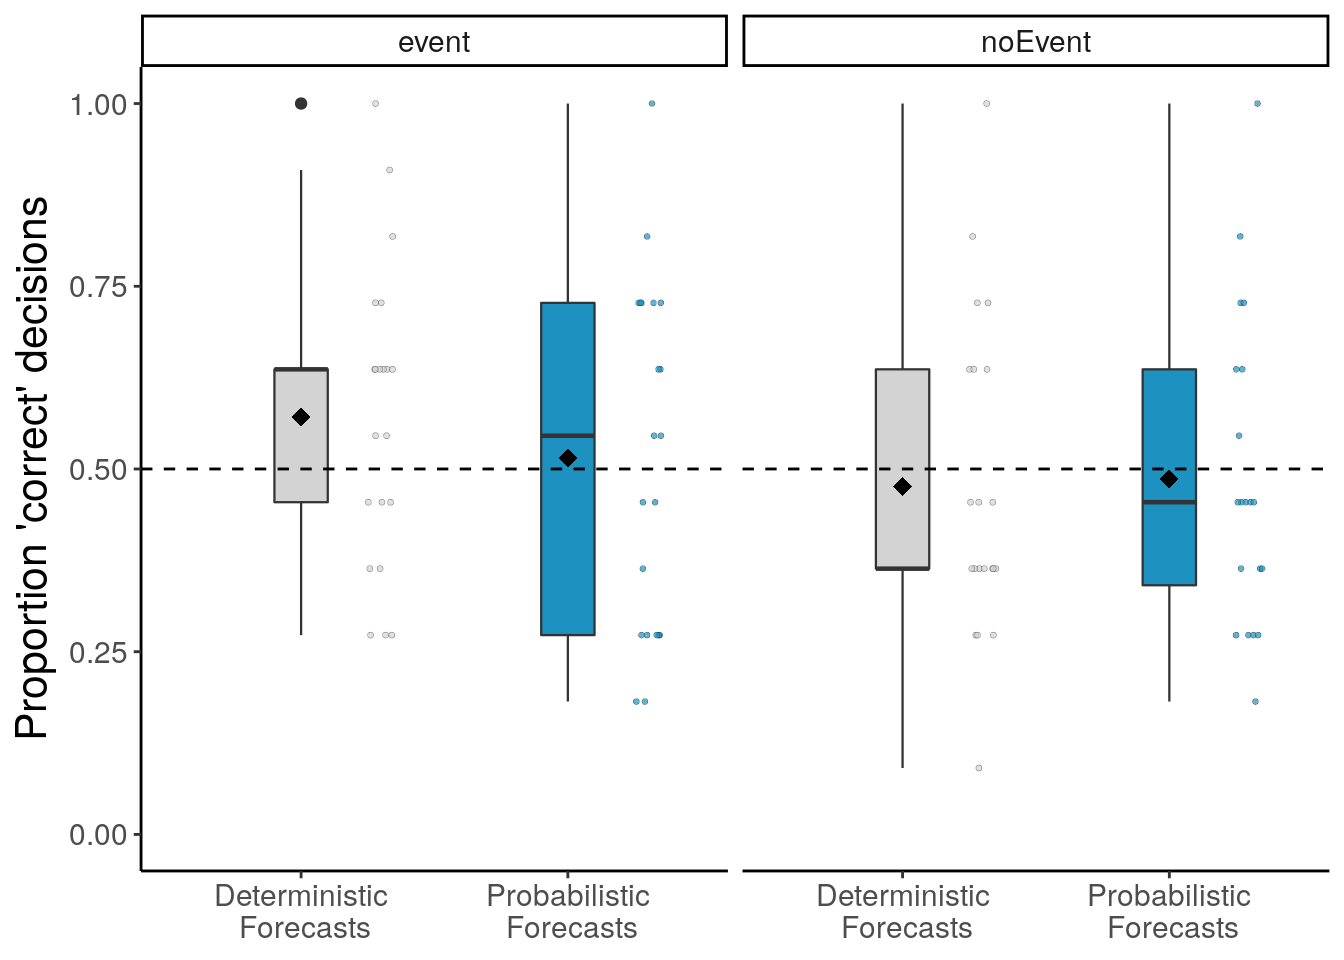
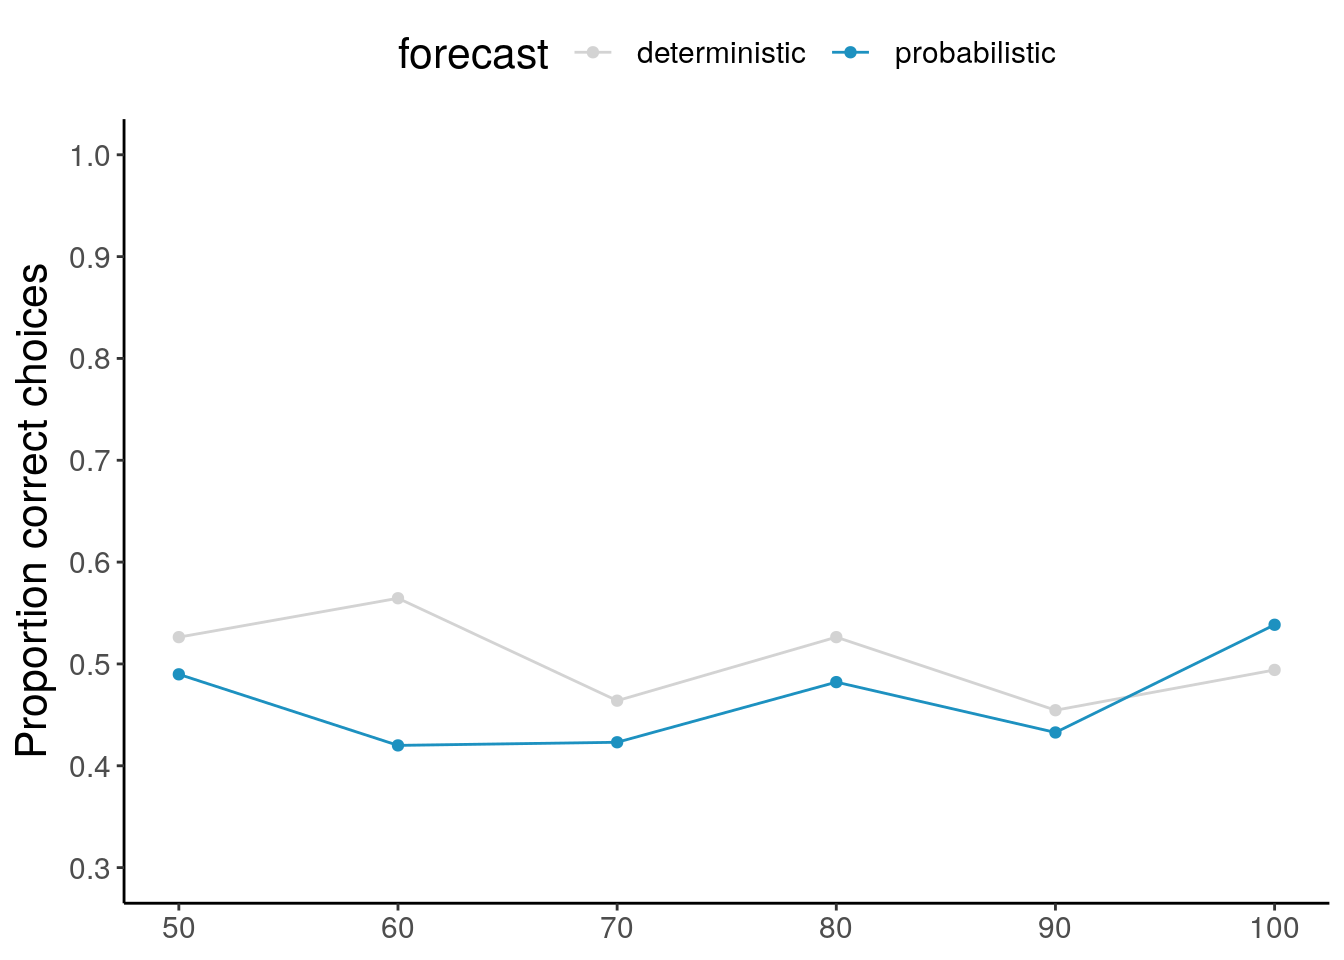
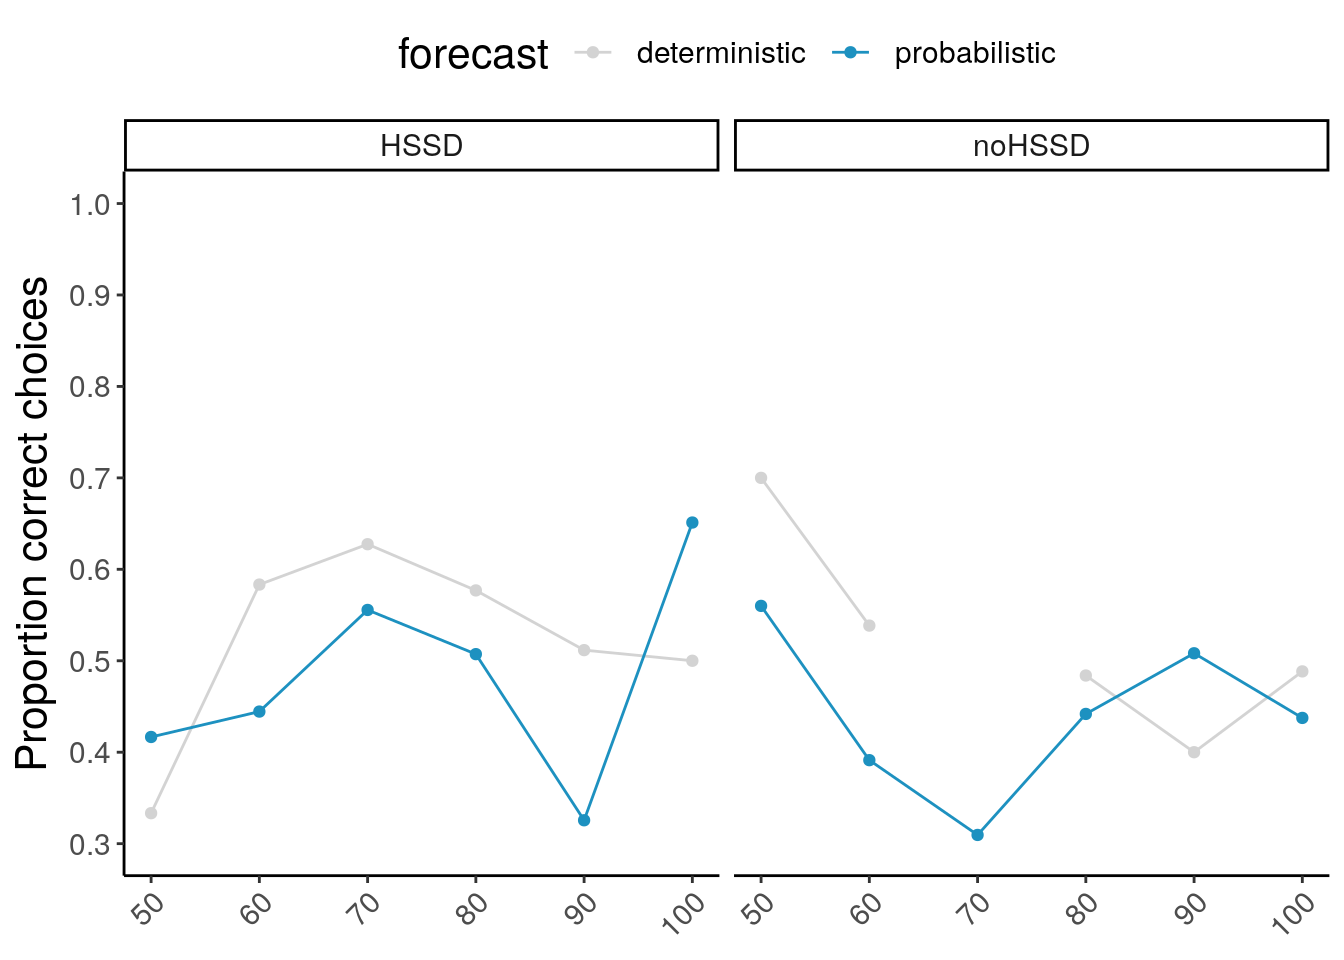
Proportion correct
Proportion of correct decisions with deterministic vs. probabilistic forecasts
Correct here means to trade 100% when there is no HSSD, and to trade 50% when there is a HSSD. However, given that people make decisions rather than a categorization judgment, there is strictly speaking no correct or incorrect because what is right or wrong depends on the payoffs, risk preference and strategy of the person. E.g. it can be perfect for someone to use a very risk averse safe strategy.
# A tibble: 4 x 3
# Groups:   event, forecast [4]
  event   forecast          n
  <chr>   <chr>         <int>
1 event   deterministic   242
2 event   probabilistic   242
3 noEvent deterministic   242
4 noEvent probabilistic   242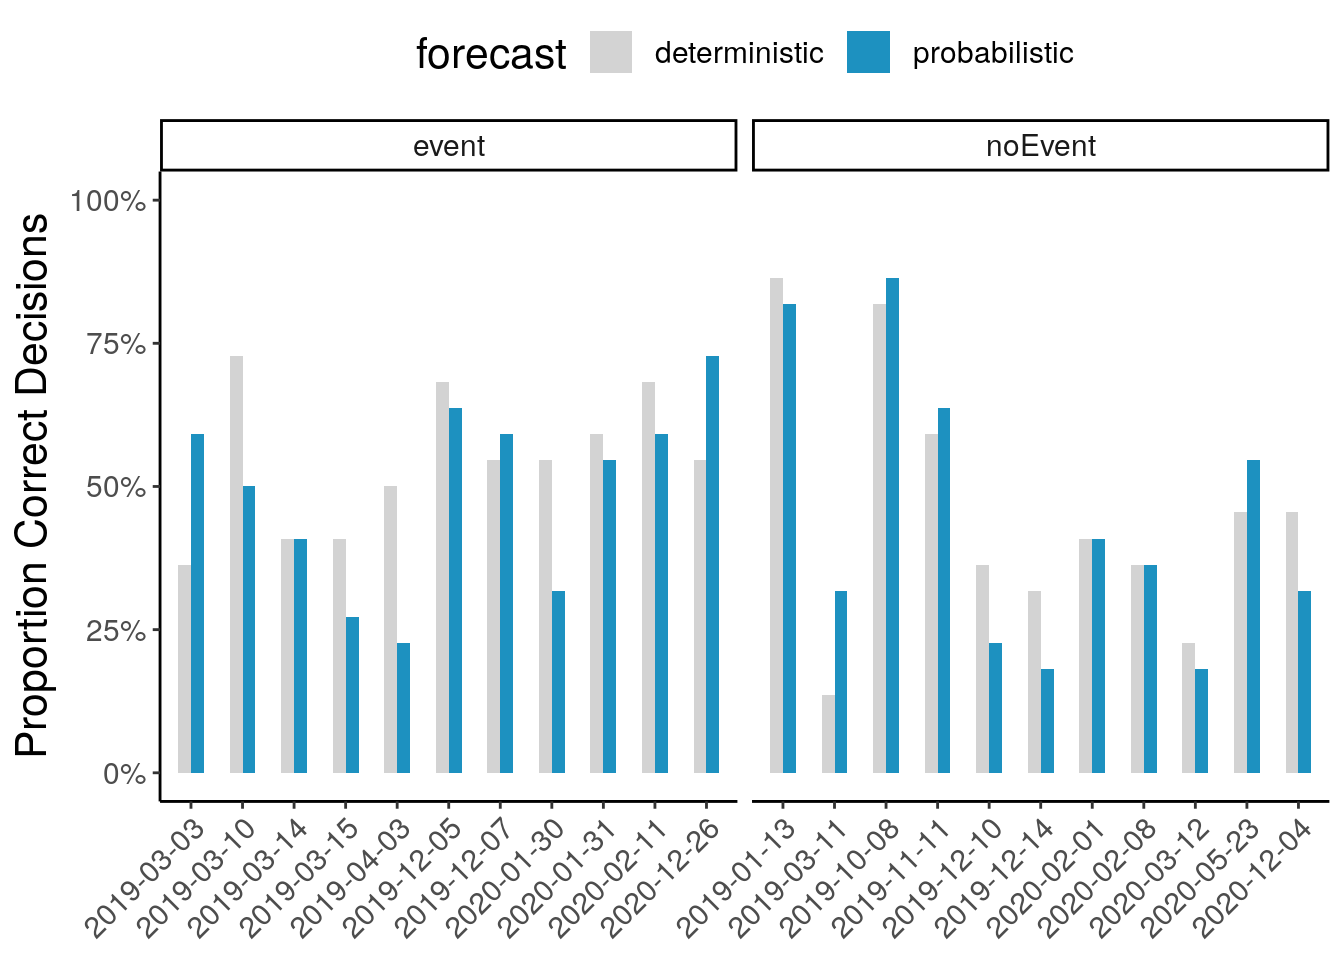
Confidence
Distribution of mean confidence per participant and per situation
   Min. 1st Qu.  Median    Mean 3rd Qu.    Max.
     53      72      79      78      84     100
Min. 1st Qu. Median Mean 3rd Qu. Max.
58 72 80 79 87 100 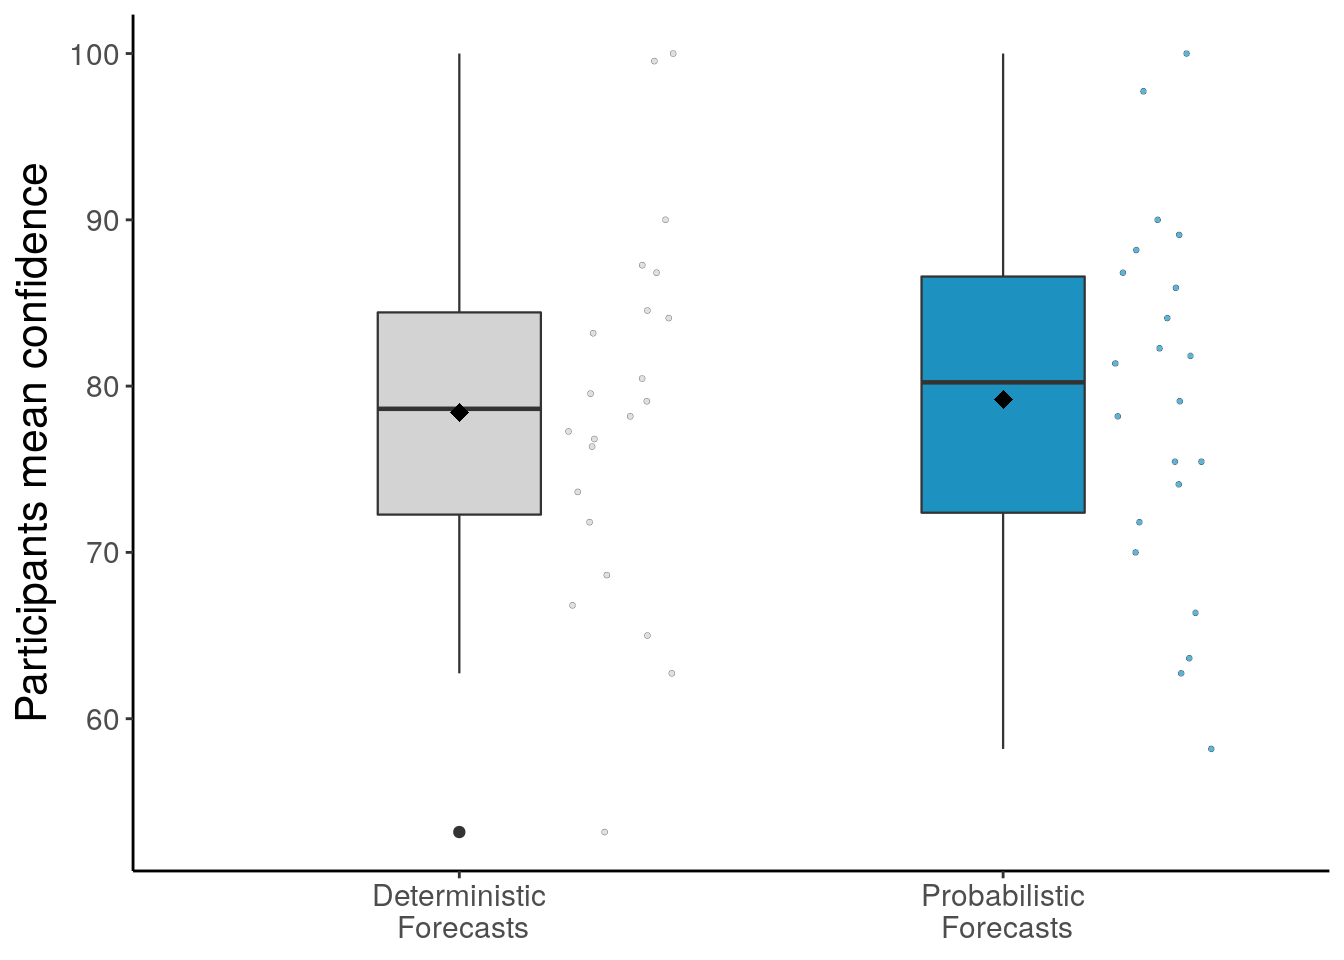
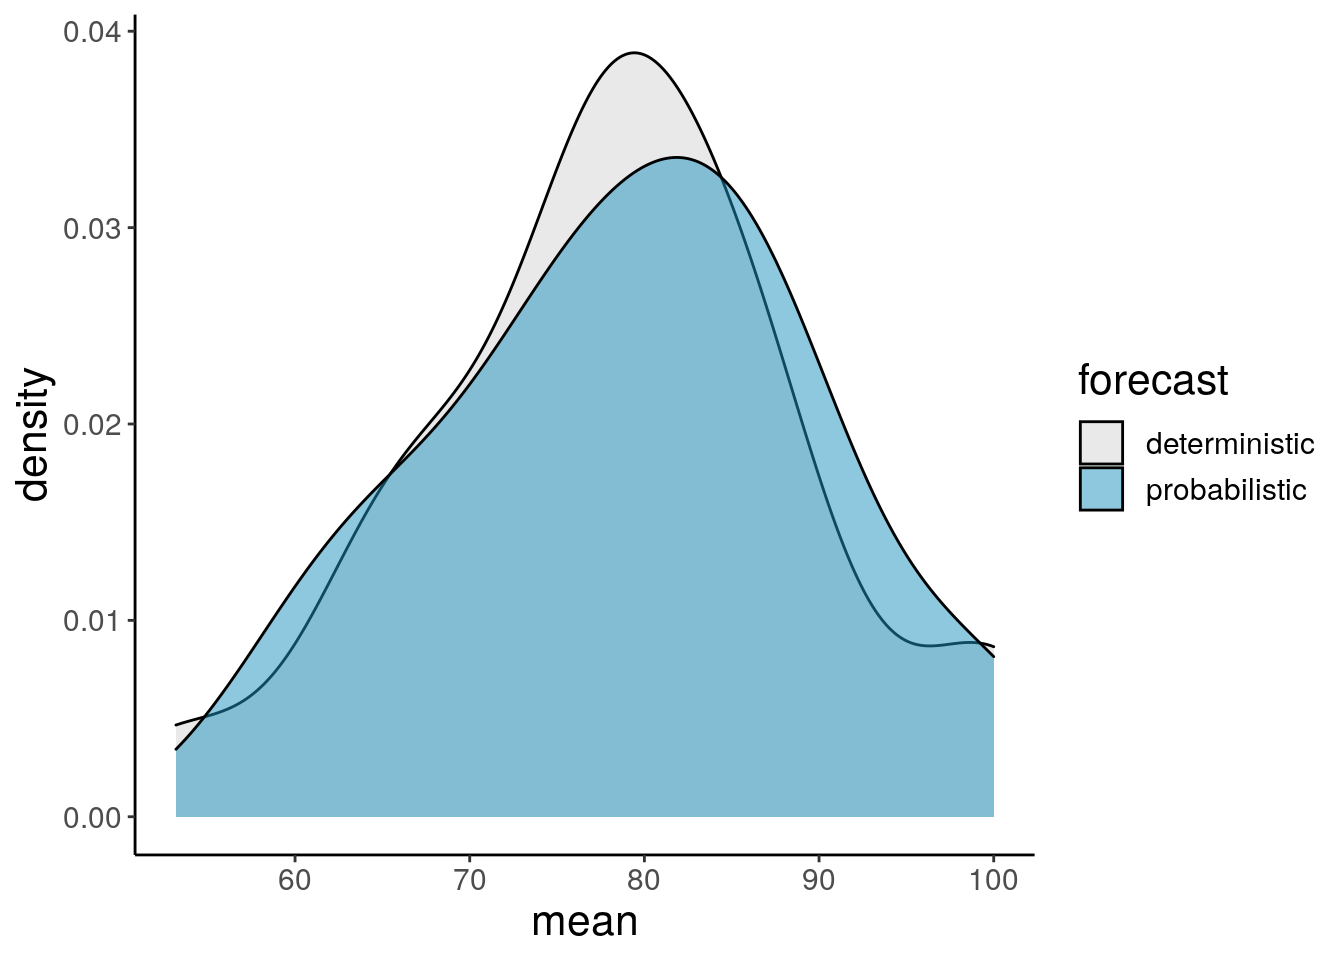
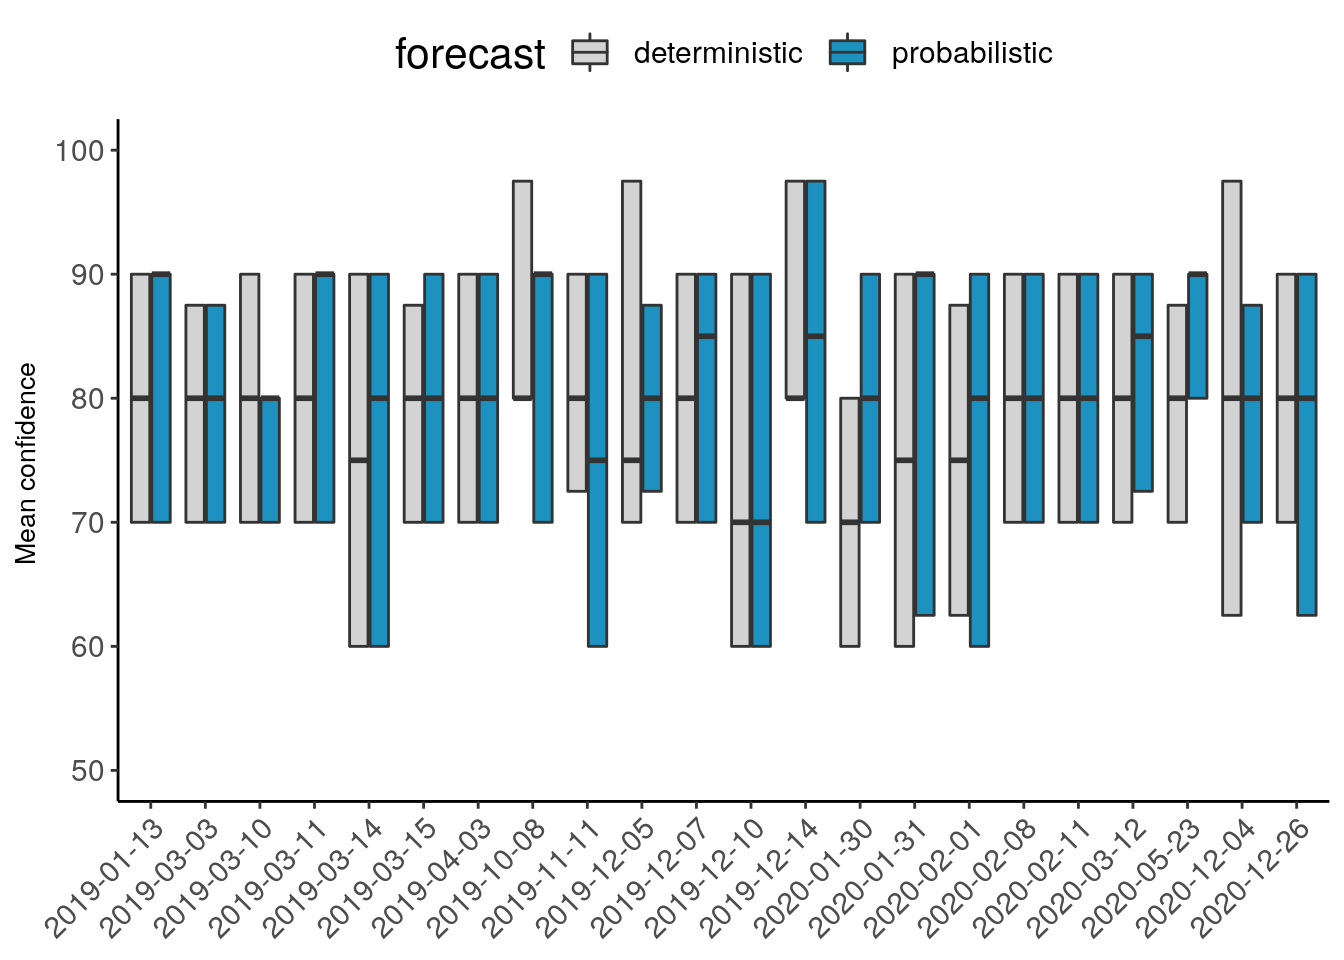
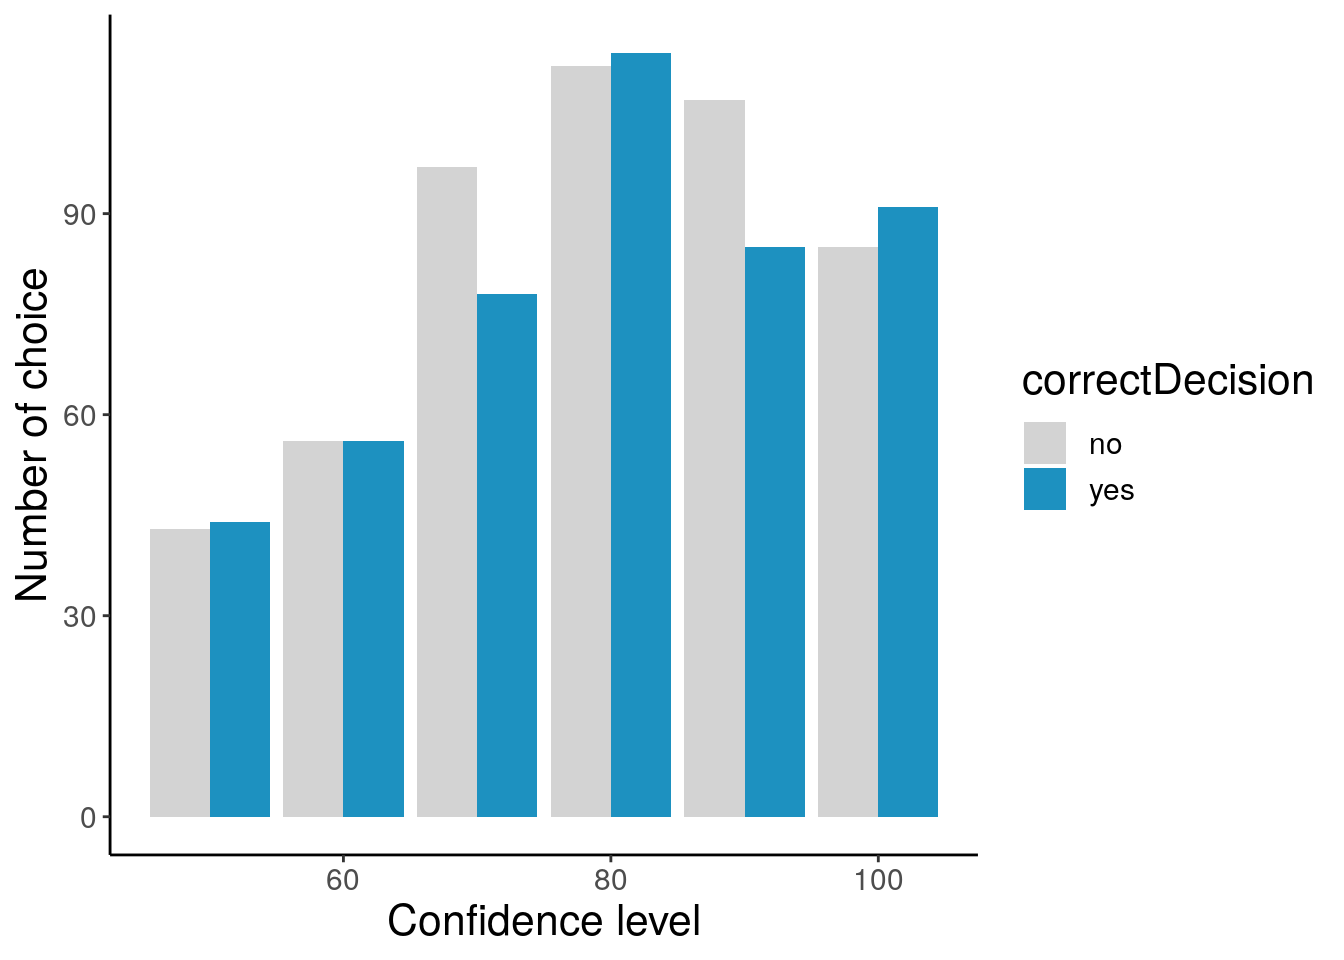
Calibration of confidence
Distribution of confidence values
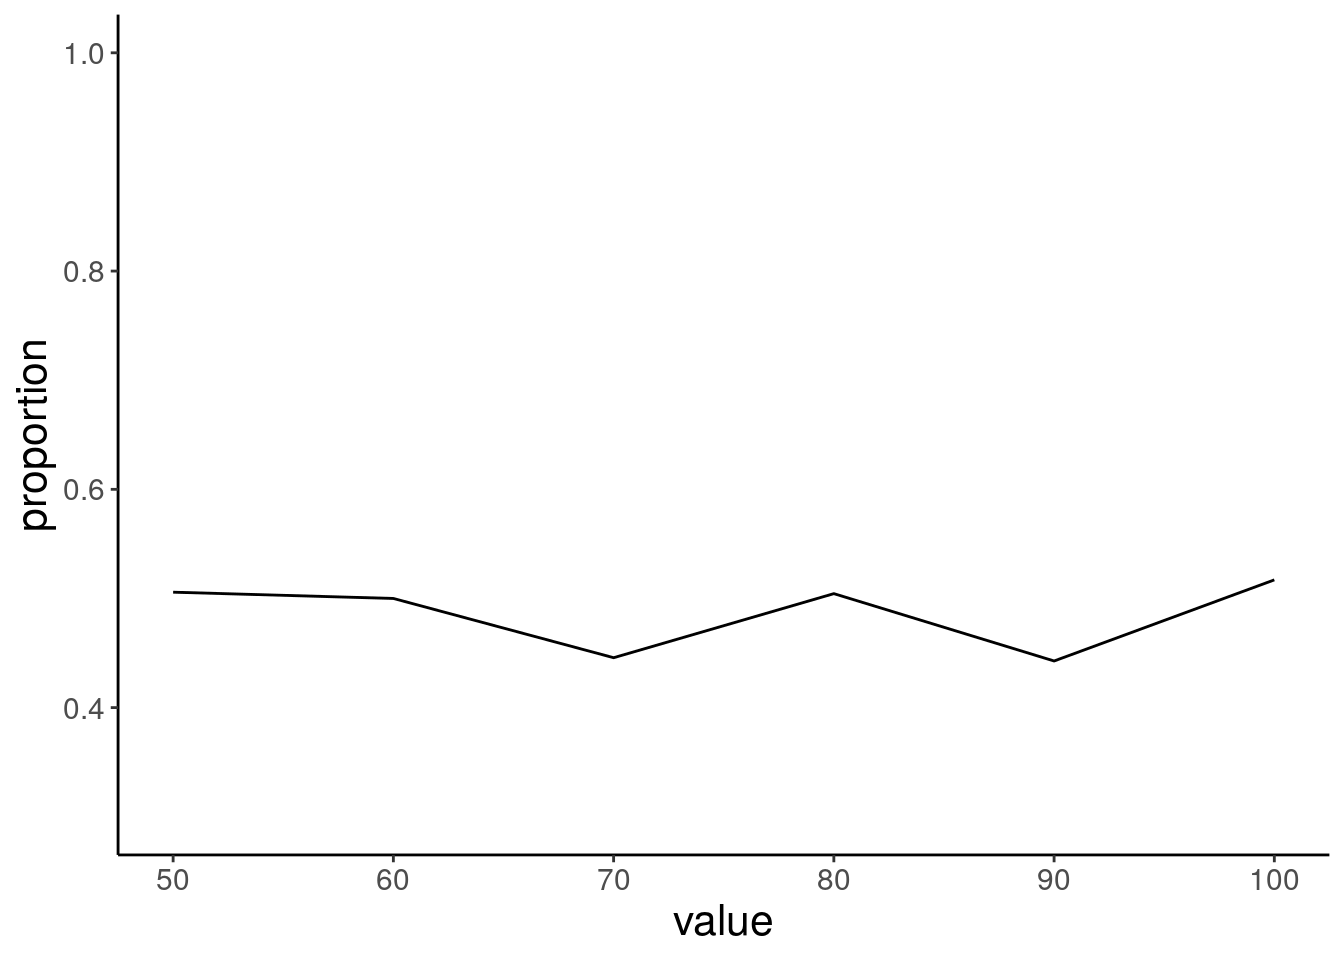
Relation of confidence to proportion correct decisions: Proportion correct for each confidence level across participants
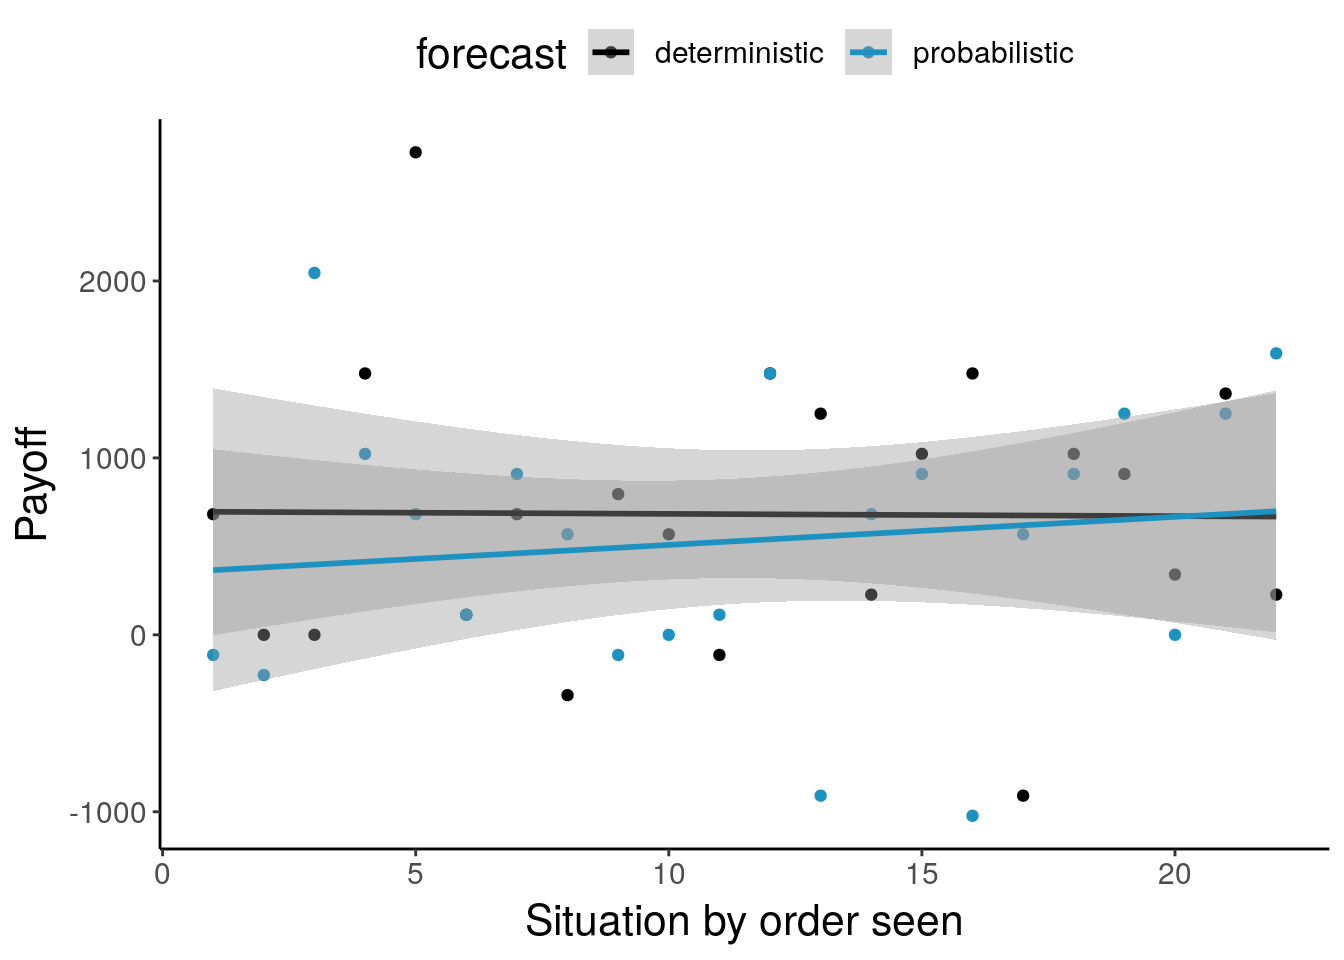
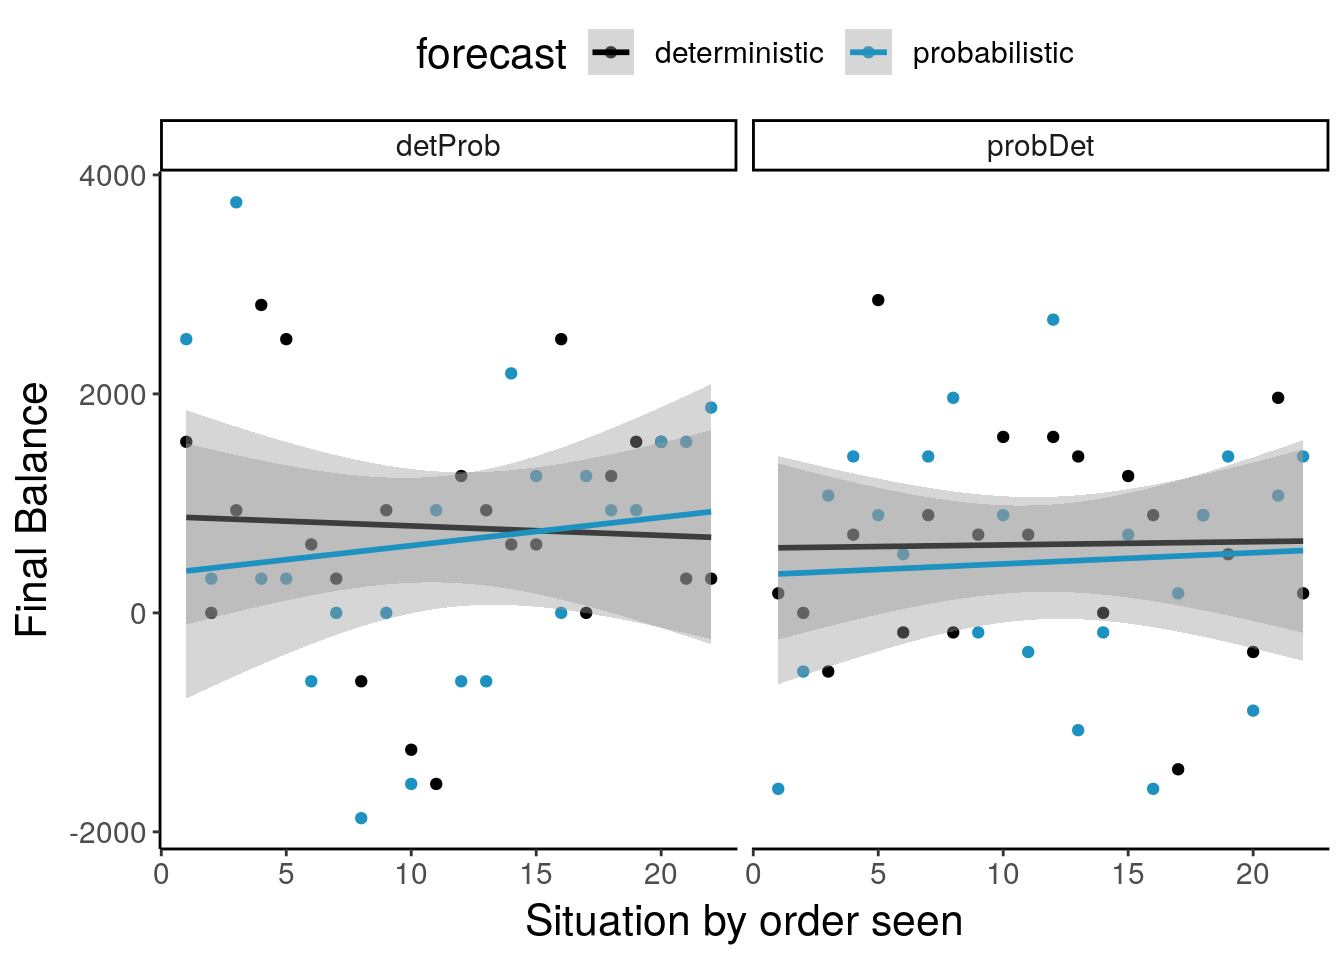
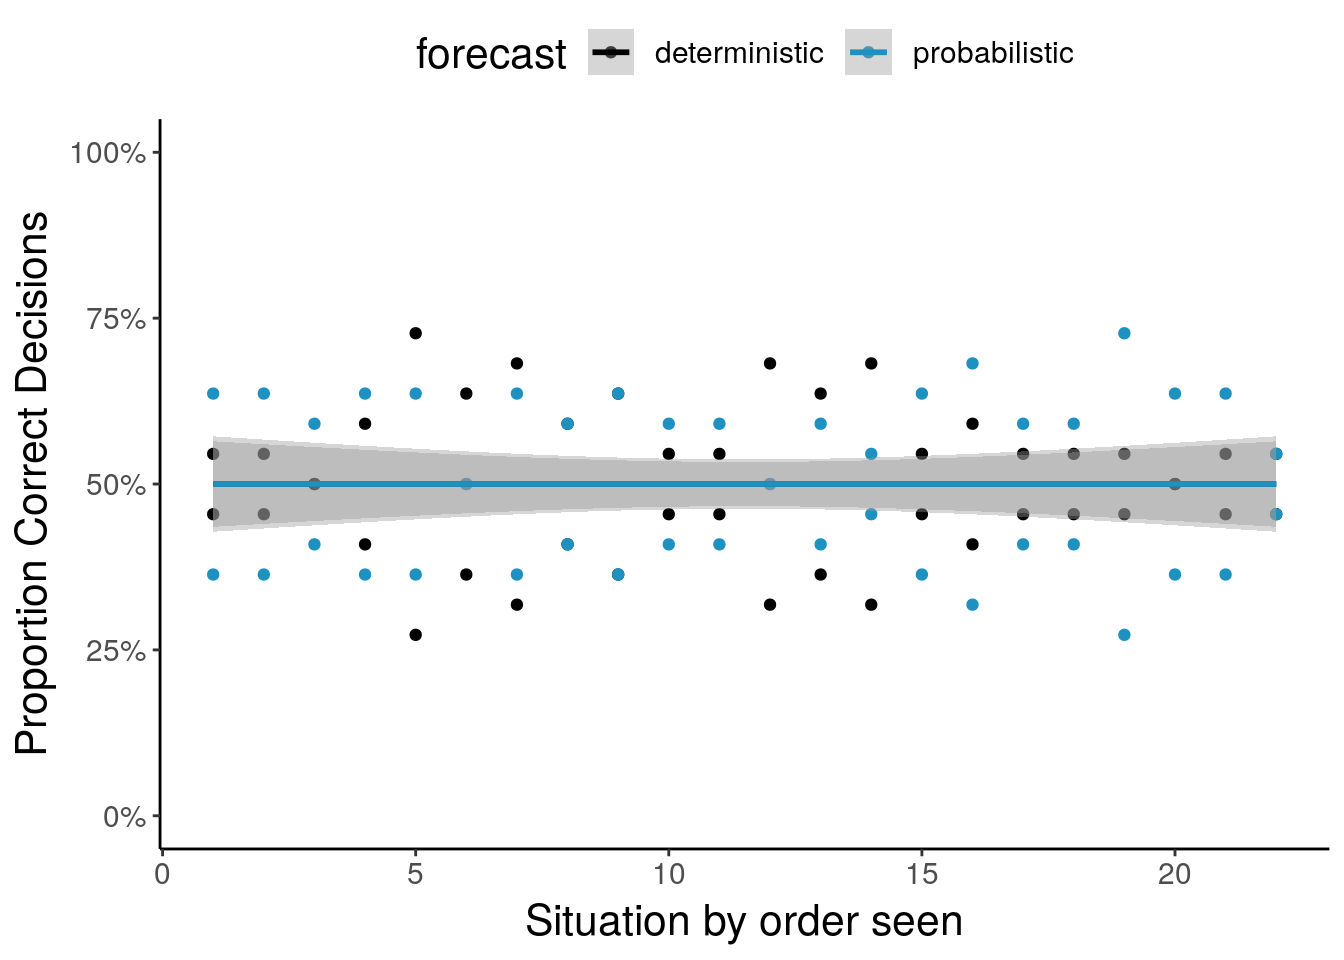
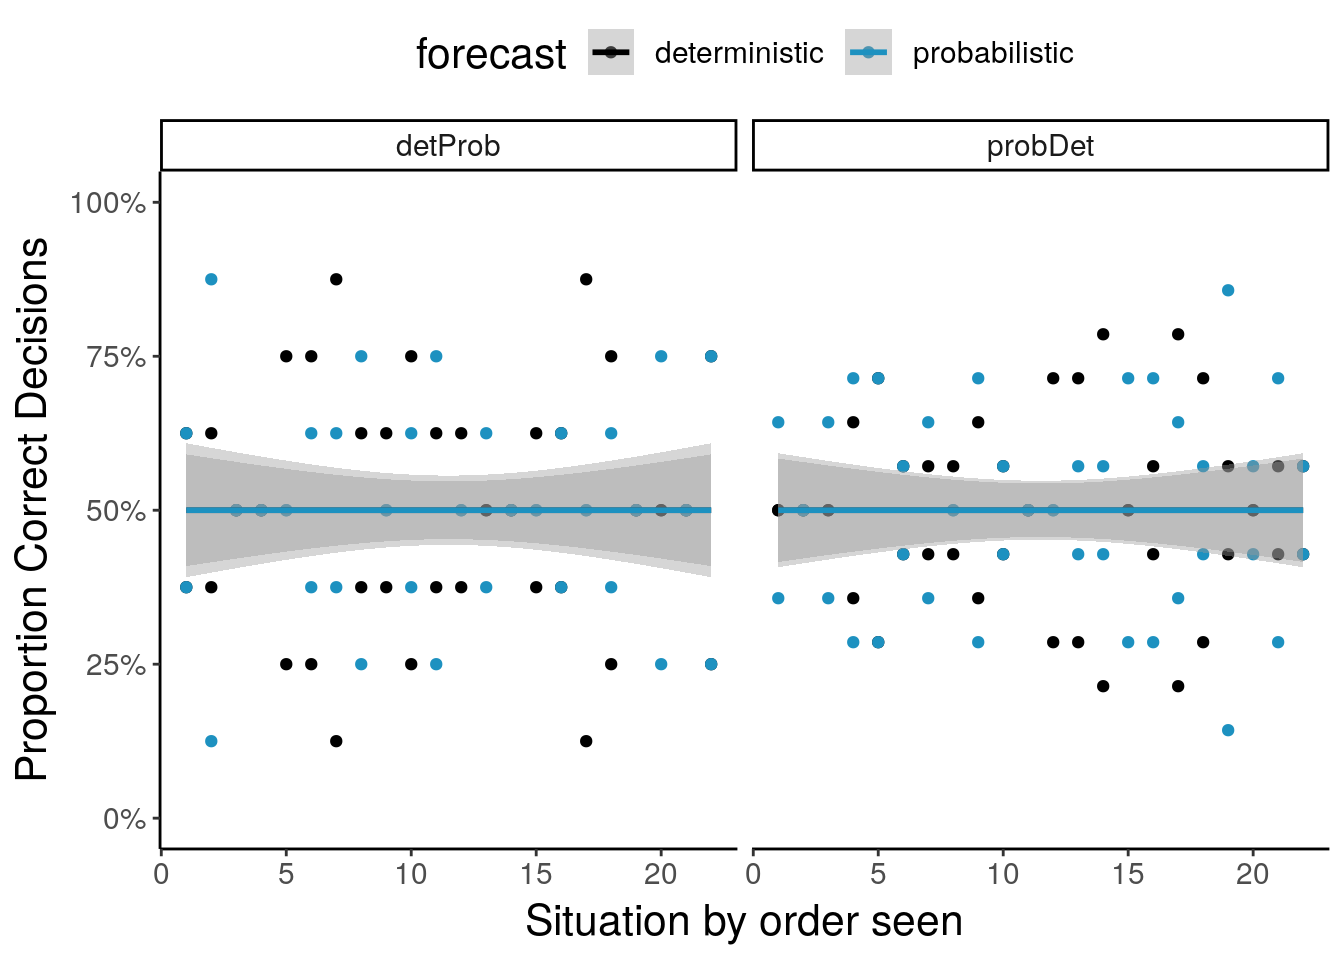
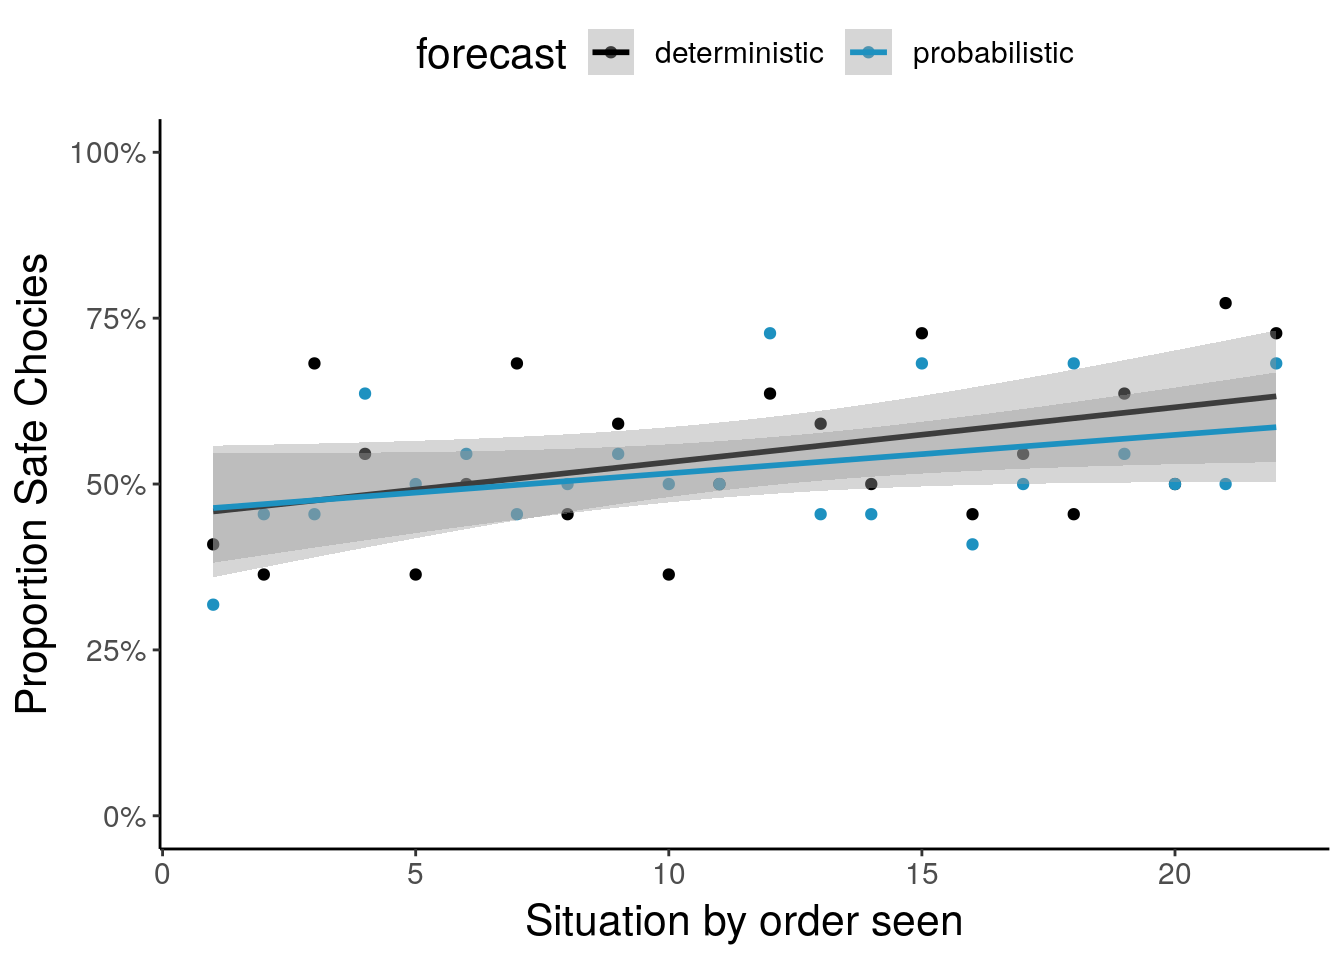
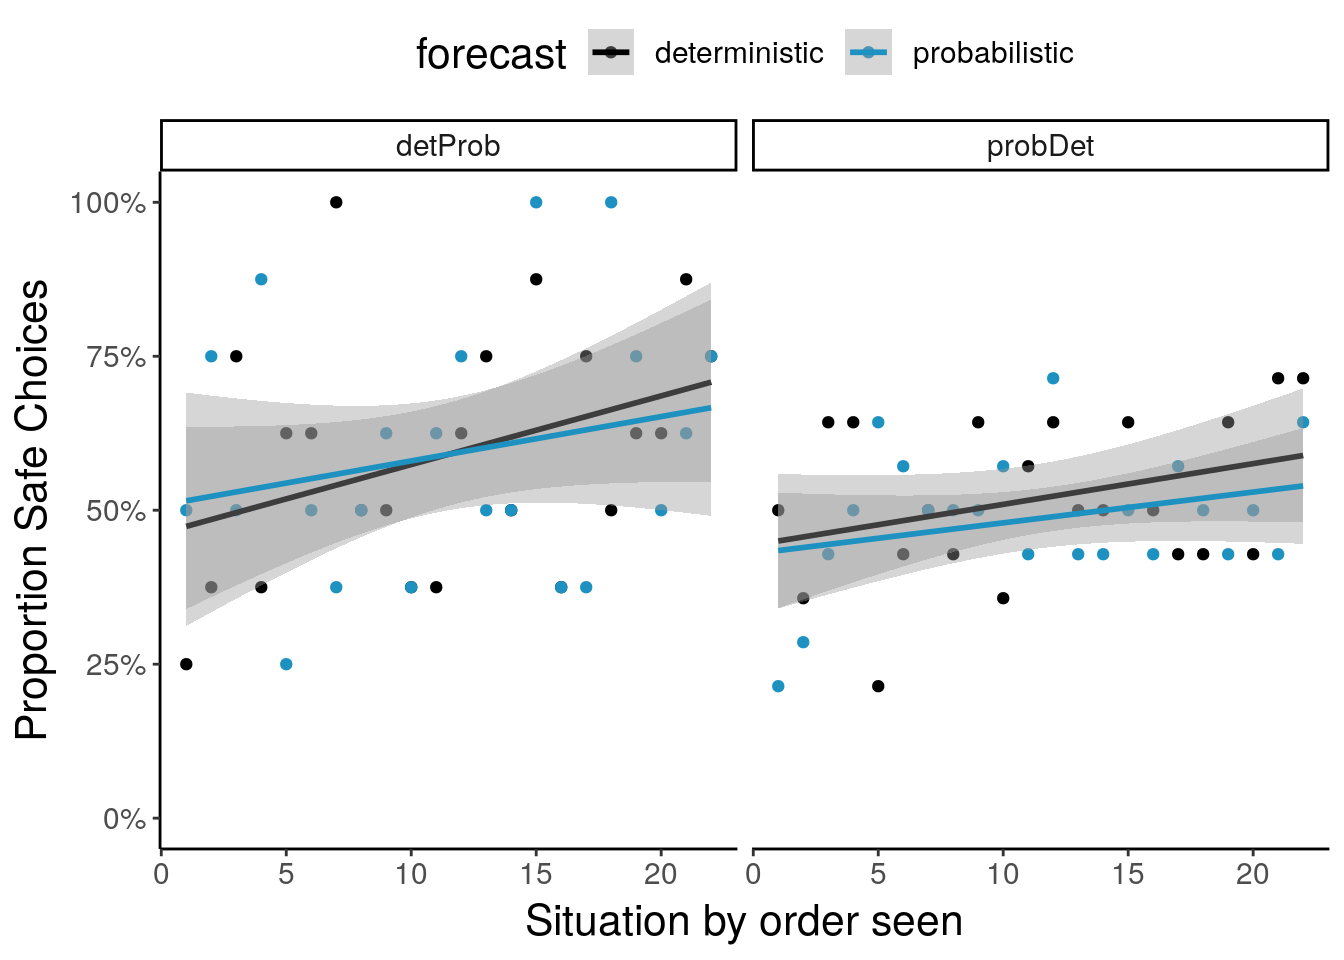
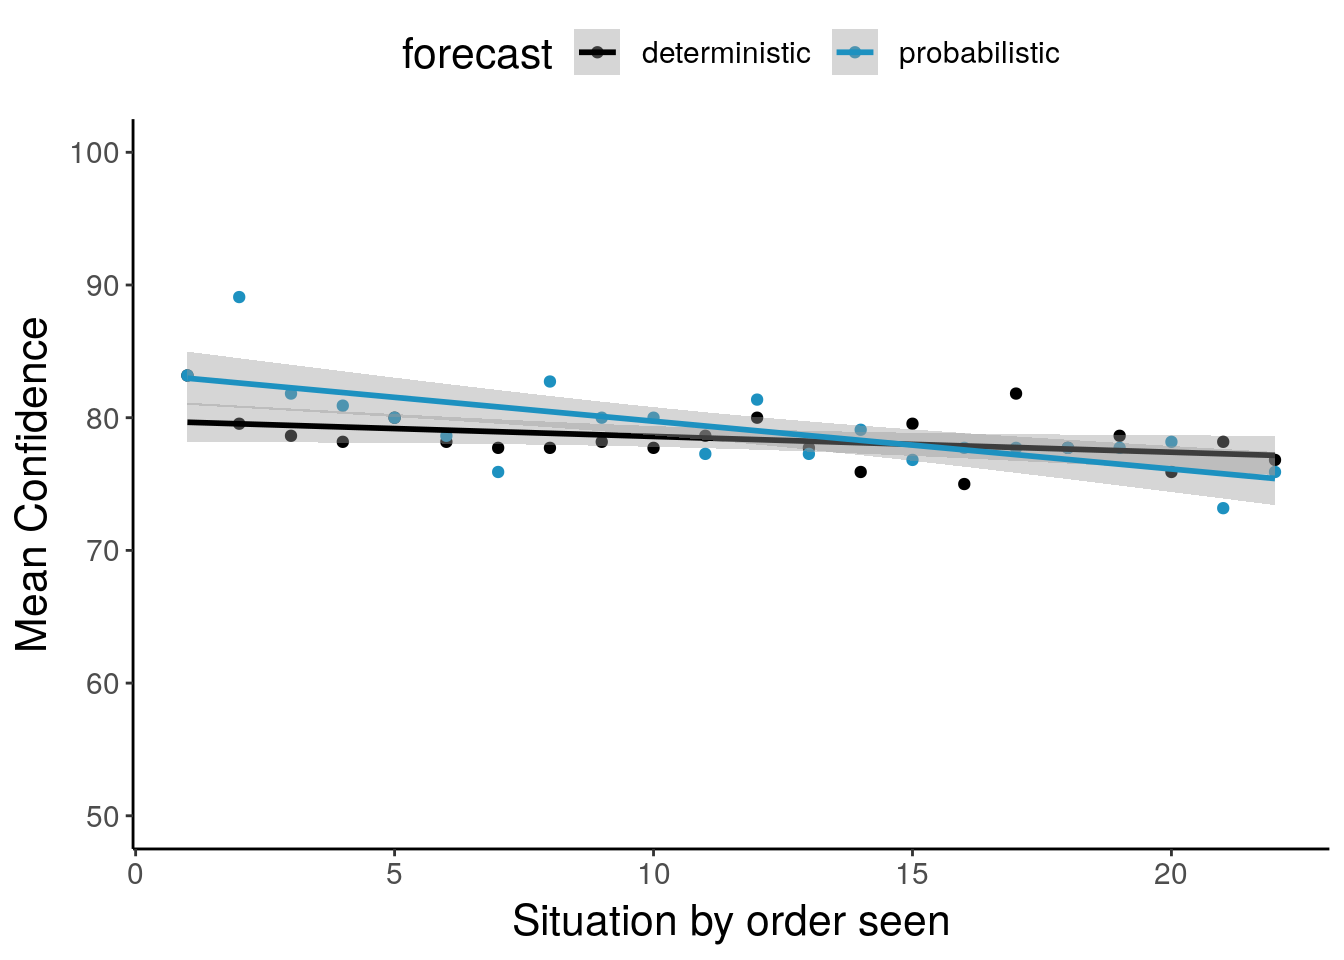
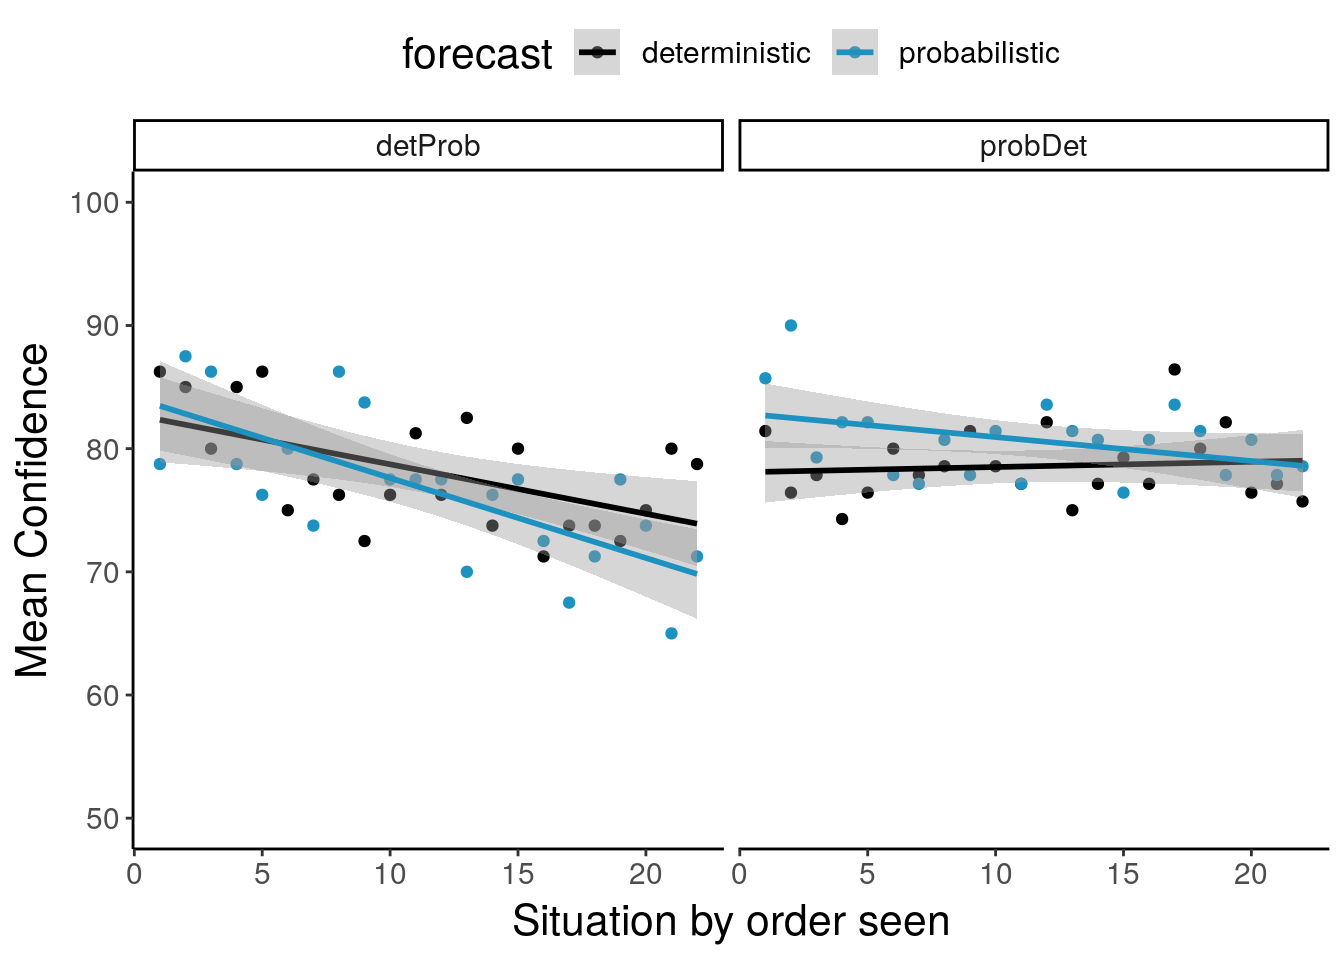
Learning
Learning curves for payoffs, proportion correct, safe choices and confidence
Strategies
Decision strategies & HSSD indicators
R Markdown website has been created using workflowr (external link)
Imprint
Privacy Policy